Quantcast
Channel: Guy on Simulink
Viewing all 159 articles
Browse latest View live

Put some Color in your LEDs: Controlling Your Raspberry Pi from your iPhone with Simulink

$
0
0

This week Mariano Lizarraga Fernandez is back to describe some cool stuff he came up with, using the iPhone and iPad Support from Simulink in combination with the Raspberry Pi Support from Simulink.

Introduction

Color-controled lighting has become increasingly popular, and, although sometimes it is purely ornamental, there is enough scientific evdidence to show that the color of the light in your environment has a direct impact on your circardian rythm.

There are multiple options in the market to buy off-the-shelf "Smart" lightbulbs and LED strips, that you can control with your mobile phone. However, wouldn't it be fun to build your own with Simulink?

In this post, we'll show you how you can do just that using Simulink, a Raspberry Pi with a Sense HAT add-on board, and your iPhone.

Producing Color Light using the Raspberry Pi's Sense HAT

The Sense HAT is a full featured add-on board that was developed specifically for the Astro Pi mission. It has a 9-DOF IMU (3 Accelerometers, 3 Gyros, and 3 magnetometers), a humidity sensor, a temperature sensor, a barometric pressure sensor and an 8 x 8 RGB LED matrix. In R2017a we introduced support for all these in our popular Hardware Support Package.

The Simulink block for the LED Matrix allows you to control the RGB value of each LED individually or all together. To test this, you can create a Model that would allow you to either change the RGB value of the LEDs running in External mode, or by reading in an UDP datagram:

Sense HAT model

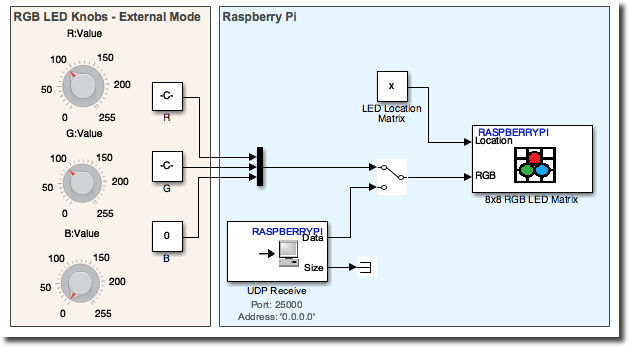
In this way, you can press play and interact with LEDs directly from Simulink or deploy it to the target and control the LEDs from another device on the same network.

Controlling your Raspberry Pi from your iPhone

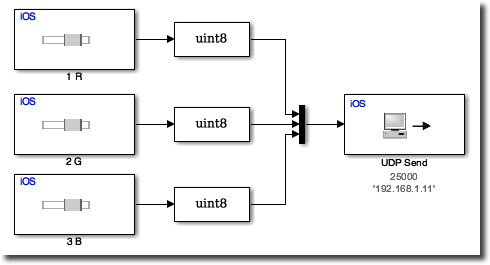
Now it is time to control those LEDs directly from your iPhone. Using the iPhone Support Package we can lay out a model where using three sliders and a UDP Send block we can send the datagram to the Raspberry Pi.It really is that simple!

simple model to be deployed on iPhone

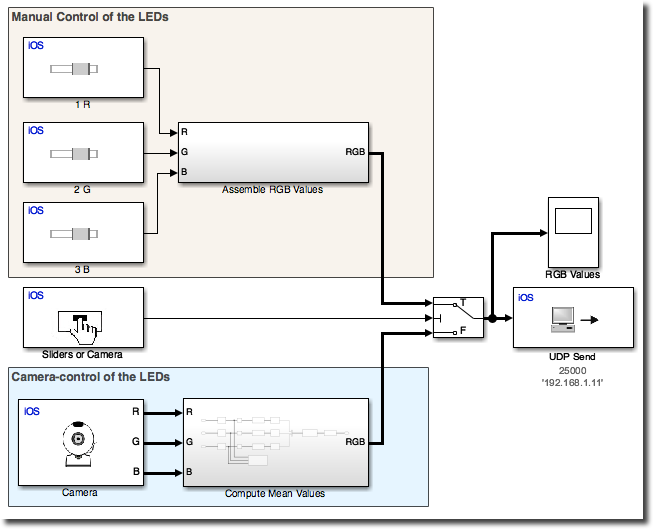
Now it is time to add some more functionality to the model. Let's try to change the color of those LEDs based on the average color of what the iPhone's back camera is looking at. To do that, we need to use the Camera block to read in the video stream. With that, we can compute the average value of each channel and send it out as a command to the LEDs. To reduce the flickering of the LEDs we can add a 5 Hz single-pole low-pass filter.

Putting it all Together

Finally, we can use both, the sliders and the image-averaging in a single model and directly control which sets the LEDs' color with a Button.

To see the actual values sent to the Raspberry Pi we can use a new feature introduced in R2017a: Simulink Scope in Mobile Apps

Full model to be deployed on iPhone

You can see it yourself in action in the following video:


http://youtu.be/bQwLTmr_NMs

Now it's your turn

If you are using the Sense HAT in your Raspberry Pi projects you can now take full advantage of the support introduced in R2017a. On the iOS Support package, the newly introduced support for the Scope block gives you access to plotting of the variables directly on your iPhone screen.

Give it a try and let us know what you think by leaving a comment below.


Simulink and the MATLAB Unit Testing Framework

$
0
0


Today, I am happy to welcome guest blogger Ajay Puvvala to talk about testing.

Some time ago, Ajay passed by my desk and offered to blog about the tight integration between Simulink Test and MATLAB Unit Testing Framework, which got introduced in R2016b.

My answer was: Yes, of course... but before, we need to introduce what the MATLAB Unit Testing Framework is, and how it can be used in a Simulink context.

This is what Ajay will be describing today.

Guest Blogger Ajay Puvvala

The Goal

As an example, we will test if the output of the code generated for a simple model matches the results of a normal mode simulation. For that, we create a harness model, and using model referencing we simulate our simple model both in normal and in Software-in-the-Loop mode.

Model to be tested

Script, Function or Class based

Depending on your preferences and needs, MATLAB Unit Testing offers three frameworks: Script-Based, Function-Based and Class-Based. The flexibility and set of features of those frameworks increase in that order.

For this post, we decided to go for function-based, since it offers everything we need, with the convenience of procedural programming.

Let's begin by the simplest possible test one could write:

Simple test

What is in this test?

  • The main function in our test uses functiontests to return an array of tests, which are the other local functions in this file taking a test handle as input.
  • The function testEquivalence is our main test, it simulates the model in normal and SIL mode, and compares the results.
  • We use addTeardown to do the cleanup once the test is completed. In this case, this means closing the model.
  • We use verifyEqual from the MATLAB Unit Test qualification library to compare the results.

When ready, use the runtests function to run all the tests in exampleTest.m.

First test

As you can see, our test failed. To make this story more interesting, I purposely configured the generated code to link against a math library where the implementation of sin is slightly different than the one used by Simulink in normal mode. In case you were not aware, there are various math libraries implementing trigonometric functions in different ways, giving slightly different results.

Diagnostics

The failure diagnostics show a table with numerical mismatches. But as they say, an image is worth a thousand words. So, how can we have better diagnostics? Luckily, qualification methods accept a user diagnostics for additional diagnosis. It could be a string or character array, function handle or matlab.unittest.diagnostics.Diagnostic object. Let’s create a diagnostic that can help us visualize these signal mismatches rather than looking at a bunch of numbers.

We add the following function to our test file exampleTest.m to launch SDI and display a comparison in case the test fails.

Adding a Diagnostic function camparing runs

and we specify this function as additional argument to verifyEqual

Diagnostic function camparing runs

This time, when the test finishes, SDI shows us how different the signals are:

Result of the Diagnostic function camparing runs

Tolerances

As we all know, doing bit-to-bit comparison with floating-point signals is usually a bad idea. You typically end up being to sensitive to floating-point roundoff errors. Instead, you want to verify that the results are equivalent within a certain tolerance.

For that, we can pass additional arguments to verifyEqual to specify relative and absolute tolerances

Adding absolute tolerance

This time, the test passes!

Passed Test

What's next?

As I mentioned previously, if you want to read more about testing in general, I recommend that you visit the Developer Zone blog, which is dedicated to this topic.

I also recommend that you go through the Testing Frameworks documentation to see all the different features available to customize and enhance the example we went through in this blog post.

Next week, we will look at how using Simulink Test’s Test Manager can simplify the testing of Simulink models. Stay tuned!

Simulation Based Testing with Simulink Test Manager

$
0
0

Today, Ajay Puvvala is back to talk about testing.

Recapitulation

In last week's post, we looked at how we could apply MATLAB Unit Testing Framework to Simulink context. We authored a scripted test to verify the output of the generated code of a simple model against normal mode simulation. In that test, we:

  1. Simulated the system under test in normal and software-in-the-loop to obtain expected and actual simulation results
  2. Leveraged the MATLAB Unit qualification API verifyEqual to compare the numerics with and without tolerance
  3. Developed a simple SDI diagnostic to visualize the signal differences for failure investigation

As you probably remember, steps 2 & 3 required writing a reasonable amount of code to extract the signals to compare and then defining a diagnostic that could help with failure analysis. That isn't unexpected, since the MATLAB Unit Testing Framework is a general purpose tool to test any software with MATLAB API. It doesn't specialize in a particular application domain.

That's where Simulink Test comes into picture, bringing in specialization for testing Simulink models. It provides tools for authoring, executing and managing simulation-based tests for models and generated code. It also provides the ability to create test harnesses that assist with testing selected components in a model independently. Its integration with products such as Simulink Verification and Validation provides a great platform for model-based testing.

Have not tried it yet? I strongly recommend you check out the product page.

The Goal

In today's post, we use Simulink Test's Test Manager to create and execute the same equivalence test we did in last week's post.

We want to validate the results of generated code, via Software-in-The-Loop simulation, against normal mode simulation of a simple model.

Normal model versus SIL comparisin

Test Manager Setup

After launching the Test Manager from the Analysis menu of the model, I select to create a new Test File From Model:

Creating a test File

and I specify the type of test:

Creating a test

Test Creation

When you select an equivalence test, it allows you to define simulation settings for two simulations. In this case, we will define Simulation 1 as normal mode simulation and Simulation 2 as software-in-the-loop simulation.

Creating equivalence test

Qualification Criteria

In the Equivalence Criteria section, you select which signal you want to compare. Using the Capture button, the Test Manager will analyze the model and list all the logged signals that could potentially be used in the comparison. In our case, it finds the Outport block, for which the logging is enabled.

Once the signals are in the table, you can specify tolerances. As we did last week, we specify an absolute tolerance to allow expected small differences between the two simulations.

Equivalance Criteria

Running the Test

Now it's time to click the Run button:

Run Test

When the test terminates, we can inspect the results. The integration of the Simulation Data Inspector within the Test Manager makes it convenient to inspect the results without writing a single line of code. In our example, we can see the small difference within the specified tolerance.

Comparing Results

Notice the Highlight in Model button. It is convenient to analyze failures in large models where many signals are logged.

What else?

I want to mention a few more items I find very useful in the Test Manager:

  • Debug: If you enable the Debug button, the Test Manager will setup everything and pause the simulation at t=0, allowing you to go step by step through the simulation to understand what is going wrong.
  • Parallel: With the Parallel Computing Toolbox, this button will run the tests in parallel, possibly saving you lots of time.
  • Time-Based Tolerances: When specifying the tolerances in the equivalence criteria, it is possible to specify leading and lagging tolerances. For example, if I am simulating a vehicle and testing in which gear the transmission is, I probably want to allow shifting to happen slightly before or after the baseline.
  • Programmatic API: Once your tests are defined and saved, it is easy to run them programmatically. With just three lines of code, you can load the test file, run the tests, and view the results.

Test API

Now it's your turn

Let us know what you think of the Test Manager by leaving a comment below.

Logging Simulation Data in Timetable format

$
0
0

In case you did not notice, MATLAB R2016b introduced a new type of table: timetables. Because Simulink logs data over time, we decided in R2017a to give the possibility to use this format for signal logging.

Configuring the Model

First, you need to enable logging for some signals. For this example, I chose a house heating example, where the simulation duration is a week. I log the inside and outside temperatures, along with the energy cost. Such a long application is particularly appropriate for timetables. You will see why later.

Enable Logging

Next, in the model configuration, ensure Signal Logging is enabled.

Enable Logging in dataset format

Finally, in the model Configuration Parameters, switch from the Commonly Used Parameters tab to the All Parameters tab. Select the Data Import/Export category, and scroll to the bottom. The DatasetSignalFormat parameter allows you to choose between timeseries and timetables. (Note: If you prefer, you can also type "DatasetSignalFormat" in the search box)

Enable Logging in dataset format and timetable

Exploring the Simulation Output

After simulating the model, a dataset object is created in the MATLAB workspace.

Logged dataset

For example, we can access the first ten points of the timetable for the "cost" signal using:

Logged dataset

Advantages of Timetables

As mentioned previously, the example used here simulates for a long period of time (7 days). Let's look at a few features of the timetables that are particularly useful for such simulation.

The first obvious advantage is that you can select the units in which the time is displayed.

Time Format

You have to admit that 6 days and 23 hours is easier to understand than 682560 seconds.

One thing I like is the indexing based on time. For example, if I want the data between the 36th and 37th hours of the simulation, I can simply define a timerange to index in the timetable:

Time Range

In a similar way, if I want to extract a few points around a specific instant, I can create a withtol subscript. In the following example, I extract the points within a +/- 2 minutes range around the 48th hour of simulation.

time tolerance intexing

Using retime, it is possible to aggregate data quite easily. The following line returns the average value for each day of simulation.

Aggretating Daily Average

Those are just a few basic examples. I recommend looking at the timetable documentation for more advanced maneuvers.

In my case, based on the example Preprocess and Explore Time-stamped Data Using timetable, I have been able to group the data in four periods of the day (AM, PM, evening and night) and get an average of the outside temperature for each of those periods during the entire week the simulation lasted.

Grouping and mean

Now it's your turn

Have you already adopted or considering adopting timetables to log your simulation data? Let us know what you think of this new feature by leaving a comment below.

Watering my Plants with Simscape Fluids

$
0
0

Here is a picture of my backyard:

My Backyard

As you can see, I like to grow a few plants. And those plants need water.

During the last long weekend of July 4th, I decided to install a watering system for those plants.

When I looked at what was available at the hardware store, I saw two options: 1/4 in hoses and 1/2 in hoses. Not being too sure which one I should pick, I decided to do some simulation first.

Sanity Check

To begin, I did a bit of googling to find out that the typical household pressure is usually between 40 and 60 PSI. Based on experience, I know that filling a 1 gallon watering container takes about 6 seconds, so I decided to simulate that first, to ensure my simulation was in the correct order of magnitude. Good news, it is:

Test model

The Real System

Having good confidence that my simulation would be realistic, I drew my setup using a series of Hydraulic Pipeline LP, where LP stands for Low Pressure.

Watering System

On the house, that would look like the following, where I drew a yellow line for a main hose, and green lines for smaller sections going directly to each plant.

Watering System

In each block, I specified the radius and length of each section:

Hose dimension

Along with the elevation, to include the effect of gravity:

Hose Elevation

My first simulation with all the system made of 1/4 in pipes showed that I would get only 2.2 GPM of water coming out of the faucet... this means that it would take forever to water my plants, and that the last one farthest from the faucet would get no water.

To improve things, I thought about making the main line with a 1/2 in hose, and then tap into it using short 1/4 in hoses to reach each pot. This time, I got 10 GPM at the faucet, which is more acceptable. However, there was one problem. The first plant as receiving a lot more water than the last one.

Final Setup

Adjustable Nozzles

To fix that, I will need to add adjustable nozzles to restrict the flow on the closest plants.

Nozzles

To simulate those, I added an orifice to the end of each hose. By leaving the last nozzle fully opened and making the orifices smaller as I was getting closer to the faucet, I could get a roughly equal flow rate on all nozzles, and keep the flow rate out of the faucet close to 10 GPM.

Final System

Final Result

With confidence, I drove to the hardware store, bought everything I needed, installed the system, and now I can sit back and look at my plants being watered!

Now it's your turn

Share with us how Simulink helps your summer vacation by leaving a comment below.

Logging Stateflow Data and States Activity

$
0
0

Today I want to describe a feature that is super useful, but not known enough: Logging states activity and data in Stateflow.

Logging Stateflow Data

If you want to quickly enable or disable logging for variables and states, select Log Chart Signals... from the Simulation menu.

Enabling Stateflow Logging

This will give you a flat list of all the items you can possibly log in your chart.

Enabling Stateflow Logging

See this documentation page for more ways of configuring Stateflow logging.

Logging Stateflow Data From Command Line

I know many of you will ask if it is possible to control Stateflow logging programmatically. For that, you can use the Stateflow API.

Let's say I want to log the local variable down_th for the example model sf_car.

Logging sf_car

All you have to do is get a handle to the Stateflow root object, use the find method to search for data or states, and set the logging property to true.

Logging sf_car programmatically

Visualizing logged data

Once logging is enabled for data and states, enable Signal Logging in the model configuration. At the end of the simulation, a dataset object appears in the MATLAB workspace.

Logged dataset including Stateflow data

You can easily plot the data using the plot method of the MATLAB timeseries objects inside the dataset:

Plot Stateflow logged data

If you prefer, you can also directly stream the Stateflow data to the Simulation Data Inspector. For that, enable the Record logged workspace data in Simulation Data Inspector from the model configuration. At the end of the simulation, the logged data will show up in the Simulation Data Inspector automatically.

Stateflow logged data in SDI

Now it's your turn

Are you taking advantage of the Stateflow logging? Let us know what you think of this feature in the comments below.

Creating Your Own Check Valve for the Simscape Gas domain

$
0
0

Some time ago, I wrote a blog post about how to implement a custom valve for the Simscape Hydraulic domain. Today I am happy to welcome guest bloggers Erin McGarrity and Ruth-Anne Marchant who will describe how to implement a similar check valve, but for the Simscape Gas domain.

The Problem

Check valves are a pretty common element in pneumatic circuits, but the Simscape Gas library does not currently have one (We are working on that, it will come soon). How would you create such a valve using the base components?

Let's begin by putting together a test harness model for our check valve. In the following model, we have two Reservoir blocks connected by pipes and a pressure source on the left side. Without a check valve, the flow would go back-and-forth based on the signal from the Sine Wave block.

Check Valve test harness

With the Check Valve, we want to allow flow in only one direction, so the response, as seen in the Simscape Results Explorer, would look like the following:

Check Valve response

Custom Check Valve Subsystem

Let's see what we have inside the Check Valve Subsystem. In this subsystem, we first use a Pressure & Temperature Sensor (G) block to measures the pressure drop across the Valve between ports A and B. We pass this pressure to a PS Lookup Table (1D) block, which then generates the opening area of a Variable Local Restriction (G) block.

Check Valve subsystem

Valve Parameterization

To parameterize the Lookup Table, we need to define the opening area as a function of the pressure difference across the valve. For this example, let's say we want our check valve to have a cracking pressure of 10kPa, and a maximum opening pressure of 40 kPa, at which the maximum opening would be 5 mm^2. This would look like:

Pressure Area relationship

Based on that information, we can parameterize the orifice:

Valve Parameters

and the Lookup Table:

Lookup Table Parameters

Valve Dynamics

Finally, we insert a first order delay to prevent the valve from “teleporting” from position to position as the pressure changes. Looking inside the OpeningDelay Subsystem we see how to accomplish this:

Opening Delay

In this Subsystem, there is a PS Gain block which is labeled “Time Constant.” The value in this block sets the amount of delay the system imposes by its inverse, for example specifying a value of 10 results in a delay of 0.1 second.

Running the simulation and looking at the Simscape Results Explorer will show results as displayed above.

Increasing the Gain in the PS Gain block in the OpeningDelay subsystem to 1 makes the valve slower to respond (1 second) and produces the following:

Opening Delay longer

As can be seen from the plot, there is a small leakage backward as the valve closes. This could represent a valve with a weak spring or resistance to closure.

Conclusion

This blog post describes one way to implement a check valve for the Simscape Gas library. There could be many others, depending on your coding preferences, and the level of accuracy your application needs.

For example, we could have implemented a similar check valve using the Simscape language. We could also have modeled the mechanical part of the valve using blocks from the Simscape mechanical domain, like masses, springs and dampers.

Let us know in the comments below if you would like us to write more about other possible ways to implement valves in Simscape.

Another Good Reason to Use Simulink Projects

$
0
0

This week I discovered a super useful a feature of Simulink Projects.

Renaming a Library

If you are using Simulink Libraries to componentize your models, you very likely ran into the following situation at some point.

You create a library block, and use that block in a model:

Using a Library block

After some time, you decide that the library file needs to be renamed. The next time you open your model, here is what you get:

Library not found

Here are a few ways to deal with that, depending on how your library block is used.

Option 1 - Manual Update

Let's begin with the obvious one. If your library subsystem is used only once in one model, the quickest solution is probably to simply double-click on the missing link block and type the new name of the library:

Library not found

Option 2 - Forwarding Table

If your library is used by hundreds or thousands of users, you should definitely be using a Forwarding Table. I wrote a blog post on this topic some time ago so I will not go into deep details here.

For this post, let's just say that Forwarding Tables give you all the flexibility you need when re-organizing libraries, but requires some work to implement. I typically implement it only when I know many other users will be affected by the re-organization.

Forwarding Table

Option 3 - Simulink Project

If you are working on a project where you have library blocks used multiple times in various project-related models, you will love this feature.

When all your models and libraries are in a Simulink Project, if you rename a library file, the project will automatically run a dependency analysis and offer you to update all the instances of the blocks from the library.

Rename a library

Update Links

Simply click Rename and Update, and magic happens, the models now all use the renamed library:

Model using renamed library

Now it's your turn

Are you already taking advantage of this feature? What's is your preferred way to manage library reorganization? Let us know in the comments below.


New in MATLAB R2017b: The Simulation Manager

$
0
0

MATLAB R2017b has recently been released. For this first post about R2017b, I want to highlight a feature that I think most of you will find very useful: The Simulation Manager

The Simulation Manager makes your life a lot easier when using the parsim function, released in R2017a. It has been added in R2017b to help visualizing the progress of your simulations, and to conveniently access results and diagnostics.

Note: If you are not familiar with the parsim function, I recommend going through this past blog post to learn more about it.

Launching the Simulation Manager

Let's begin by setting an example: I will simulate this simple mechanical system 10 times, with different values for the Mass block highlighted in yellow:

Simscape Example

To run those simulations, I create an array of 10 Simulink.SimulationInput objects. For each of them, I use the setBlockParameter method to specify a different value for the Mass block. Then I pass this array to parsim, with the new ShowSimulationManager option set to on.

Parsim Example

and the Simulation Manager window opens:

Simulation Manager

Progress

The first thing you will notice is the progress of each simulation. For each run, you can see if it is active, completed, or got an error.

When selecting one run, you can see the list of parameters specific to this run, time info and diagnostics in the Simulation Details pane.

If you have a large number of runs, you probably want to try the Grid view instead of the default List view. This will allow you to get a big picture on the success of all your runs more easily.

Grid View

One convenient thing to note: If you click the Stop Job button, parsim will return the results for already completed runs. This is more convenient than hitting Ctrl+C, which would have caused you to lose all the results from the job.

Viewing Results

When you are ready to visualize and compare results, the Show Results button will launch the Simulation Data Inspector for the selected runs (You can use Ctrl+click to select multiple runs). Notice how the Simulation Data Inspector has been revamped in R2017b, more on that in another blog post.

Simulation Data Inspector

Diagnosing Errors

In this example, the Diagnostics tab help me quickly see that the first simulation failed because the Mass value I specified is zero, which is not allowed. I like how the diagnostic is displayed with the same look and feel as the Diagnostic Viewer.

Diagnostics

My Favorite Thing!

Now it's time to talk about my favorite feature of the Simulation Manager: Open Selected.

Open Selected

Anybody who tried to debug errors happening on a remote cluster will probably agree that this can be challenging. Since the parallel workers have no user interface, getting information out of there can be tricky. Debugging in a local MATLAB session is significantly easier.

This is what the Open Selected button does. It opens the model and configures your local MATLAB session like the parallel worker for the selected run. This allows you to add Scopes, log more data, do whatever you typically do while debugging models.

Now it's your turn

Give a try at the Simulation Manager and let us know how you like it.

Simulink Subsystems as Stateflow States

$
0
0

Today I want to highlight a new feature that makes continuous-time modeling in Stateflow clearer and more powerful: Simulink Subsystems as States.

Background

In case you did not know, for many releases, it has been possible to do continuous-time modeling in Stateflow.

For simulations where you need to model a plant that has discrete modes or discrete events, modeling the plant in Stateflow can be convenient. To see such example, I recommended looking at the Bouncing Ball, or the Newton Craddle examples.

Based on models I receive for technical support, what users typically do when they need to model a continuous plant with discrete modes is that they will model the continuous equations using Simulink blocks, and they will implement the mode switching logic in Stateflow. An example of that is the clutch example in R2017a, which looks like that:

Clutch example from R2017a

If you ever tried modeling such system, you very likely ran into errors like the following one at some point. The reason is that the Stateflow logic needs the output of the continuous system, and the continuous systems are controlled by the Stateflow chart, creating a loop.

Data Dependency violation

As you will see in the following example, with Simulink subsystems as state, we are now able to pull the continuous algorithm modeled with blocks inside Stateflow, avoiding all those data dependency challenges

Simulink Subsystems as States

To demonstrate this feature, I decided to model a box on a plate moving up and down. When the plate is moving slow, the box and the plate move together as one. If the plate moves fast, the box might leave the plate, free falling in the air.

In the first case, the system dynamics can be modeled as:

Box and Plate together

In the second case, this looks like:

Box no on plate

To include those two subsystems in Stateflow, I add two Simulink State and paste the subsystems shown above in each of them. The Inport and Outport blocks of the subsystems will automatically become the inputs and outputs of the Stateflow chart.

Simulink subsystem as state

Then I need to name the state of each Integrator block. Those names will be used in the next step to transfer the state when switching mode.

Naming states

Once this is done, I can define the logic to switch between these two modes.

When the acceleration is larger than gravity in the negative direction, the box will start flying. On the opposite direction, if the box falls and its position becomes smaller or equal to the plate, it lands and begin to move with the plate again. To define those transitions, I can use the inputs and outputs of the chart, and the states explicitly named as described above.

Every time the switching happens, we transfer the states so that the Integrator blocks in the activated subsystem gets initialized with the last values of the Integrator blocks in the subsystem being deactivated.

Final Chart

And that's it, as simple as that! Without the Simulink subsystem as state, modeling this system would have taken a lot more blocks and wiring.

I can now use a PID controller to control the motion of the plate.

Final model

If I apply a sinusoidal motion with a high frequency, results show the box jumping on the plate:

Final Results

Now it's your turn

To see how Simulink subsystems as state can affect the modeling semantics, I recommend comparing the clutch example in R2017a and R2017b. This should make it obvious how this feature simplifies the semantics.

Give this a try and let us know what you think in the comments below.

Modecharts: Modeling discrete modes in Simscape

$
0
0

Last week I described how to model a box on a moving table using Simulink subsystems as Stateflow state.

As it is the case for most systems, there are many ways to model this box-table system in Simulink. I thought it would be interesting to model the same system this week using a new Simscape feature: Modecharts

Background

In a way similar to the Simulink Subsystems as Stateflow states, Simscape modecharts are designed to model systems with discrete operating modes.

In our example of a box on a table, the two modes are:

  • Locked: The box and the table are moving together at equal velocity, the table is able to generate whatever force is needed to keep their velocity equal.
  • Unlocked: The box flies in the air, zero forces are generated between the table and the box

To implement my table-box relationship, I thought it would be a good idea to get inspired by the fundamental friction clutch. If you look at the documentation, you will find the following diagram for the unidirectional case, which is very close to what I need. The only thing I need to change is the condition to lock, which will be function of the position instead of the velocity.

Clutch logic

Notice that we cannot have only two modes like in the Stateflow case. To avoid the solver chattering between locked and unlocked, we introduce a "waiting" state where we wait after getting out of the locked state to have reached a threshold velocity before reaching the unlocked state.

Mode Charts

Now, how do we implement that in Simscape?

To begin, we use the Simscape language to create a standard component with two ports from the mechanical translational domain. To help with that, I recommend starting with one of the component from the foundation library, for example a spring. This will look like:

Simscape code

Then we can begin defining our modes. In our modecharts, we need to define 3 sections: the modes,
the transitions, and the initial mode.

About the modes, in the case we are locked, the equation we want is the velocity between the two ports to be zero. In all the other modes, the equation we want is the force between the two ports to be zero.

modes

For the transitions, for each transition in the above diagram, we specify the source state, the destination state, and the condition when the transition should happen.

transitions

Finally, we can specify in which mode the simulation will start. If you do not specify one, the first mode defined will be used.

modes

Now that our component is complete, we can grab a Simscape Component block and specify the SSC-file we just created.

Simscape Component Block

To create a simulation similar to last week, we connect an Ideal Velocity Source to the base (this will be our moving base), and a Mass to the other port (this will be our box). Using Motion Sensor blocks, we can confirm that the motion is as expected.

The Model

The results

Now it's your turn

After going through the exercise of modeling this system in both Stateflow and Simscape, do you know what I conclude? I want an hybrid of both where I could create a Simscape modechart using the convenience of the Stateflow user interface. Wouldn't it be amazing?

Do you think such feature would be useful for you? Let us know in the comments below, along what you will do with Simscape modecharts.

Revisited: How Many Blocks are in that Model?

$
0
0

A long time ago, Seth wrote a post showing how to count the number of blocks in a model, including referenced models. At that time, using the functions find_mdlrefs to find all the referenced models and running sldiagnostics on each of them was the way to go.

In R2017b, Simulink Check introduces a new and easy way of finding out how many blocks are in a Simulink models, along with a lot of associated metrics: The Metrics Dashboard.

Block Count

To understand the sort of data that the Dashboard Metrics includes, I think it is a good idea to start with a simple model. For that, I will use the example model sf_car.slx. To get started, I launch the Dashboard Metrics from the Analysis menu:

Launching the Metrics Dashboard

Then I click the All Metrics button to begin the analysis:

Launching the Metrics Dashboard

Within the few seconds, I get the following report:

Launching the Metrics Dashboard

Let's click on some of those metrics to see what they can tell us. To begin, let's click on the number of blocks. This opens a table listing all the components in the model, and how many blocks they contain.

Block count

For example, we can see that the Transmission Subsystem contains 7 blocks, and 25 blocks including its descendants: Torque Converter (10 blocks) and Transmission Ratio (8 blocks).

Block count in transmission subsystem

More Metrics

In a way similar to the block count, the Metrics Dashboard can tell you how many and where in your model are the lines of MATLAB code (inside MATLAB Function blocks), lines of code inside Stateflow charts, and parameters.

More Metrics

In the above image, if I click on the number 10 in the System Interface section, I can see that the Engine subsystem uses 4 parameters from the base workspace:

Parameter Count

After verification, I confirm that the Engine subsystem really uses 4 parameters: 3 in the Engine Torque Lookup Table, and 1 in the Gain block

Parameter Count

Improving your model based on metrics

Now let's switch to a larger, more complex model. For that, I will use a hybrid electric vehicle example from the Powertrain Blockset.

One interesting metric for this model is the library reuse, which shows that many subsystems have identical copies in the model.

Library reuse

If you click on the metric to look at the details, you will notice a button saying Open Conversion Tool:

Conversion Tool

This will launch a tool that can in one click replace all the copies of the subsystem in your model by instances of one library block.

Clones

As you can imagine, doing this refactoring should help to avoid situations where you could modify one copy of the subsystem and forget to modify the other copies.

Now it's your turn

The Metrics Dashboard contains a lot more information, I recommend going through the Model Metrics documentation page to get the full list.

Try this new feature on your models and let us know in the comments below if you find something interesting. Also, let us know if there are additional metrics you are using and would like to see being included in the dashboard.

Programming a PARROT Minidrone using Simulink

$
0
0

You know what I did this weekend? Yes, as the title of this post says, I deployed custom flight control software to my Parrot Rolling Spider Minidrone

Simulink Support Package for PARROT Minidrones

Last Christmas, my girlfriend got me one of those Parrot Rolling Spider Minidrone.

PARROT Mini drone

Immediately, I thought it would be cool to program it using Simulink. At that time, I did some research and it sounded pretty complicated to install a custom firmware and glue all the necessary code together.

Not anymore, with the recent release of the PARROT Minidrones Support Package.

Today I will describe my first experience using this package.

Installation

To get started, open the Add-On Explorer from the MATLAB toolstrip.

Add-on menu

In the Explorer, search for "PARROT Minidrone", click Install, and follow the instructions. Once the package is installed, the installer will guide you through the hardware setup.

This setup will first update the minidrone firmware. Notice that once the firmware is updated, you will not be able to fly the minidrone from the smartphone app anymore. As one of my colleagues likes to say: When you update the firmware, you are converting a toy into an experimental device.

Updating firmware

If you want to bring your minidrone back to "toy mode", you will need to go to the PARROT website and follow the instructions to reset the original firmware.

Once the firmware is updated, you will need to connect to the minidrone through Bluetooth. Once again, the Hardware Setup window will guide you through all the steps:

Connecting to the minidrone

First Test

The best way to get started with programming the minidrone is using the Quadcopter Project, included with the Aerospace Blockset. In MATLAB, type asbQuadcopterExample to open the example.

Quadcopter Example model

This example is a full simulation of a PARROT minidrone. As you can imagine, we will not generate code for this entire model. What we want is generating code for the model flightControlSystem.slx, which is referenced by the FCS block.

Quadcopter Flight Control Model

In the Simulink Project click on the shortcut named Set PARROT Target

Configure the model for PARROT drone

This will setup a few things in the model configuration to make the generated code compatible with the minidrone.

Configure the model for PARROT drone

In the model, click the Build Button to generate code. Once the code generation is complete, go to the MATLAB prompt to connect to the minidrone, and start execution of the code.

Starting the code

For a first test, the line p.setPowerGain(20) is probably a good idea. It will instruct the drone to use 20% of the power available. That way, the drone will not fly, but the motors will move to confirm that the code is running.

What's Next?

The way things work, the customized firmware expects a library with a specific function and signature. In the example model, there are two bus objects specified on the two root-level Inport matching this expected signature. As output, a vector of 4 power commands, one per motor, is expected.

Available Sensor

To familiarize yourself with all the sensors available, I recommend enabling MAT-file logging in the model configuration, and use To Workspace blocks in the model to log the sensors signals. After your flight terminates, you will then be able to exeute p.getMatFile to retrieve the logged signals from the drone and analyze them.

My First flight

Confirm that I could change the model and see the effect, I used a Signal Builder to command the drone to fly at a fixed height and move left and right. Here is what it looks like in action:

Now it's your turn

Install the Simulink Support Package for PARROT Minidrones and let us know if you are able to improve the stability of the flight controller, or implement cool features like line or target tracking using the downward pointing camera.

Highlight To Source and Destination: A new way to navigate your model

$
0
0

In the United States, Thanksgiving weekend is probably the weekend where the roads are the busiest. For those of you who got stuck in traffic to visit family and friends this past weekend, I thought I should share one of my favorite new feature in R2017b: The enhanced highlighting to source and destination.

Thanks to this new feature, you can now navigate through the signal lines in a Simulink model like if you were the only car on a highway. And you know the best: There is no traffic and no speed limits!

Navigating through a Simulink model, with the Arrow Keys

In R2017b, click on any Simulink signal to see the options to highlight to source or destination. Click on one of those, and Simulink will turn into what I call "Navigation Mode". From there, you can use the keyboard arrow keys to control the highlighting. With the left and right keys, you can navigate to the upstream or downstream block:

Highlight Sources and desitnations

When multiple sources or destinations are available, use the up and down keys to toggle between the possible sources and destinations:

toggle ports

As you would expect, the navigation can take you inside and outside of subsystems and referenced models:

navigate subsystems

Now it's your turn

This feature saved me a lot of time while debugging models in the last few months. Give it a try and let us know what you think in the comments below.

Simulating the World’s longest Ultra High Voltage Transmission Line with Simscape Power Systems

$
0
0

This week, I am happy to welcome guest blogger Hao Chen who will describe how Simscape Power Systems can be used to simulate the world's longest (3324 km) Ultra High Voltage DC (± 1100 kV) transmission system with the largest transmission capacity (24000 MW) in China.

Hao Chen, Power Systems expert and guest blogger

Starting with an Example

Simscape Power Systems includes a lot of examples. For most systems you could model, there is probably an example that you could use as a good starting point.

In this case, we will start with the example titled VSC-Based HVDC Transmission System (Detailed Model).

VSC-Based HVDC Transmission System (Detailed Model)

This example illustrates a 200 MVA (± 100 kV) voltage source converter-based HVDC system with 75 km transmission distance. If you are interested in the detailed system configuration and control design, I recommend visiting this documentation page:

https://www.mathworks.com/help/releases/R2017b/physmod/sps/powersys/ug/vsc-based-hvdc-link.html

Modifying the Example

With a few modifications, you may easily upgrade this example model to any of your desired HVDC systems. For example, after making the following changes, we can get the aforementioned most advanced HVDC system:

  • Voltage and power ratings of transformers and AC filters in both converter stations
  • Transmission cable parameters

For example, for the transmission cabler parameters, this means changing the Line Length (km) from 75 to 3324 and increasing the number of pi sections accordingly in the dialog of the PI section Line block:

Inceasing the transmission line length

What to do with this model?

Starting from this specific model, you may accomplish the following typical tasks:

  • Active/reactive power and DC voltage regulation
  • Transient stability study under different disturbances

The following simulation results illustrate a steady-state operation/regulation of the system:

  • After the DC voltages (± 1100 kV) are established at Station 2 (Trace 1: 0 second ~ 1 second), 24000 MW active power and 0 MVAr reactive power are transmitted at Station 1 (Trace 2 and Trace 3: 1 second ~ 2 second)
  • At 2 second, the transmitted active power is decreased to 21600 MW
  • At 2.5 second, the transmitted reactive power is decreased to -2400 MVAr which implies that the AC system1 absorbs 2400 MVAr reactive power from Station 1
  • At 3 second, the DC voltages are controlled to be ± 1000 kV.

Simulation Resulots

What's Next?

You could easily expand this model to include other components like wind power plants in the AC system at the Rectifier Station side. For your convenience, Simscape Power System provides many wind turbine models including most popular configurations, such as fixed-speed induction generator-based wind turbines, doubly fed induction generator-based wind turbine, and fully rated converter-based wind turbines. Look at those examples for more details:

https://www.mathworks.com/help/releases/R2017b/physmod/sps/examples.html#d2e3515


Another Good Reason to Use Simulink Projects

$
0
0

This week I discovered a super useful a feature of Simulink Projects.

Renaming a Library

If you are using Simulink Libraries to componentize your models, you very likely ran into the following situation at some point.

You create a library block, and use that block in a model:

Using a Library block

After some time, you decide that the library file needs to be renamed. The next time you open your model, here is what you get:

Library not found

Here are a few ways to deal with that, depending on how your library block is used.

Option 1 - Manual Update

Let's begin with the obvious one. If your library subsystem is used only once in one model, the quickest solution is probably to simply double-click on the missing link block and type the new name of the library:

Library not found

Option 2 - Forwarding Table

If your library is used by hundreds or thousands of users, you should definitely be using a Forwarding Table. I wrote a blog post on this topic some time ago so I will not go into deep details here.

For this post, let's just say that Forwarding Tables give you all the flexibility you need when re-organizing libraries, but requires some work to implement. I typically implement it only when I know many other users will be affected by the re-organization.

Forwarding Table

Option 3 - Simulink Project

If you are working on a project where you have library blocks used multiple times in various project-related models, you will love this feature.

When all your models and libraries are in a Simulink Project, if you rename a library file, the project will automatically run a dependency analysis and offer you to update all the instances of the blocks from the library.

Rename a library

Update Links

Simply click Rename and Update, and magic happens, the models now all use the renamed library:

Model using renamed library

Now it's your turn

Are you already taking advantage of this feature? What's is your preferred way to manage library reorganization? Let us know in the comments below.

New in MATLAB R2017b: The Simulation Manager

$
0
0

MATLAB R2017b has recently been released. For this first post about R2017b, I want to highlight a feature that I think most of you will find very useful: The Simulation Manager

The Simulation Manager makes your life a lot easier when using the parsim function, released in R2017a. It has been added in R2017b to help visualizing the progress of your simulations, and to conveniently access results and diagnostics.

Note: If you are not familiar with the parsim function, I recommend going through this past blog post to learn more about it.

Launching the Simulation Manager

Let's begin by setting an example: I will simulate this simple mechanical system 10 times, with different values for the Mass block highlighted in yellow:

Simscape Example

To run those simulations, I create an array of 10 Simulink.SimulationInput objects. For each of them, I use the setBlockParameter method to specify a different value for the Mass block. Then I pass this array to parsim, with the new ShowSimulationManager option set to on.

Parsim Example

and the Simulation Manager window opens:

Simulation Manager

Progress

The first thing you will notice is the progress of each simulation. For each run, you can see if it is active, completed, or got an error.

When selecting one run, you can see the list of parameters specific to this run, time info and diagnostics in the Simulation Details pane.

If you have a large number of runs, you probably want to try the Grid view instead of the default List view. This will allow you to get a big picture on the success of all your runs more easily.

Grid View

One convenient thing to note: If you click the Stop Job button, parsim will return the results for already completed runs. This is more convenient than hitting Ctrl+C, which would have caused you to lose all the results from the job.

Viewing Results

When you are ready to visualize and compare results, the Show Results button will launch the Simulation Data Inspector for the selected runs (You can use Ctrl+click to select multiple runs). Notice how the Simulation Data Inspector has been revamped in R2017b, more on that in another blog post.

Simulation Data Inspector

Diagnosing Errors

In this example, the Diagnostics tab help me quickly see that the first simulation failed because the Mass value I specified is zero, which is not allowed. I like how the diagnostic is displayed with the same look and feel as the Diagnostic Viewer.

Diagnostics

My Favorite Thing!

Now it's time to talk about my favorite feature of the Simulation Manager: Open Selected.

Open Selected

Anybody who tried to debug errors happening on a remote cluster will probably agree that this can be challenging. Since the parallel workers have no user interface, getting information out of there can be tricky. Debugging in a local MATLAB session is significantly easier.

This is what the Open Selected button does. It opens the model and configures your local MATLAB session like the parallel worker for the selected run. This allows you to add Scopes, log more data, do whatever you typically do while debugging models.

Now it's your turn

Give a try at the Simulation Manager and let us know how you like it.

Simulink Subsystems as Stateflow States

$
0
0

Today I want to highlight a new feature that makes continuous-time modeling in Stateflow clearer and more powerful: Simulink Subsystems as States.

Background

In case you did not know, for many releases, it has been possible to do continuous-time modeling in Stateflow.

For simulations where you need to model a plant that has discrete modes or discrete events, modeling the plant in Stateflow can be convenient. To see such example, I recommended looking at the Bouncing Ball, or the Newton Craddle examples.

Based on models I receive for technical support, what users typically do when they need to model a continuous plant with discrete modes is that they will model the continuous equations using Simulink blocks, and they will implement the mode switching logic in Stateflow. An example of that is the clutch example in R2017a, which looks like that:

Clutch example from R2017a

If you ever tried modeling such system, you very likely ran into errors like the following one at some point. The reason is that the Stateflow logic needs the output of the continuous system, and the continuous systems are controlled by the Stateflow chart, creating a loop.

Data Dependency violation

As you will see in the following example, with Simulink subsystems as state, we are now able to pull the continuous algorithm modeled with blocks inside Stateflow, avoiding all those data dependency challenges

Simulink Subsystems as States

To demonstrate this feature, I decided to model a box on a plate moving up and down. When the plate is moving slow, the box and the plate move together as one. If the plate moves fast, the box might leave the plate, free falling in the air.

In the first case, the system dynamics can be modeled as:

Box and Plate together

In the second case, this looks like:

Box no on plate

To include those two subsystems in Stateflow, I add two Simulink State and paste the subsystems shown above in each of them. The Inport and Outport blocks of the subsystems will automatically become the inputs and outputs of the Stateflow chart.

Simulink subsystem as state

Then I need to name the state of each Integrator block. Those names will be used in the next step to transfer the state when switching mode.

Naming states

Once this is done, I can define the logic to switch between these two modes.

When the acceleration is larger than gravity in the negative direction, the box will start flying. On the opposite direction, if the box falls and its position becomes smaller or equal to the plate, it lands and begin to move with the plate again. To define those transitions, I can use the inputs and outputs of the chart, and the states explicitly named as described above.

Every time the switching happens, we transfer the states so that the Integrator blocks in the activated subsystem gets initialized with the last values of the Integrator blocks in the subsystem being deactivated.

Final Chart

And that's it, as simple as that! Without the Simulink subsystem as state, modeling this system would have taken a lot more blocks and wiring.

I can now use a PID controller to control the motion of the plate.

Final model

If I apply a sinusoidal motion with a high frequency, results show the box jumping on the plate:

Final Results

Now it's your turn

To see how Simulink subsystems as state can affect the modeling semantics, I recommend comparing the clutch example in R2017a and R2017b. This should make it obvious how this feature simplifies the semantics.

Give this a try and let us know what you think in the comments below.

Modecharts: Modeling discrete modes in Simscape

$
0
0

Last week I described how to model a box on a moving table using Simulink subsystems as Stateflow state.

As it is the case for most systems, there are many ways to model this box-table system in Simulink. I thought it would be interesting to model the same system this week using a new Simscape feature: Modecharts

Background

In a way similar to the Simulink Subsystems as Stateflow states, Simscape modecharts are designed to model systems with discrete operating modes.

In our example of a box on a table, the two modes are:

  • Locked: The box and the table are moving together at equal velocity, the table is able to generate whatever force is needed to keep their velocity equal.
  • Unlocked: The box flies in the air, zero forces are generated between the table and the box

To implement my table-box relationship, I thought it would be a good idea to get inspired by the fundamental friction clutch. If you look at the documentation, you will find the following diagram for the unidirectional case, which is very close to what I need. The only thing I need to change is the condition to lock, which will be function of the position instead of the velocity.

Clutch logic

Notice that we cannot have only two modes like in the Stateflow case. To avoid the solver chattering between locked and unlocked, we introduce a "waiting" state where we wait after getting out of the locked state to have reached a threshold velocity before reaching the unlocked state.

Mode Charts

Now, how do we implement that in Simscape?

To begin, we use the Simscape language to create a standard component with two ports from the mechanical translational domain. To help with that, I recommend starting with one of the component from the foundation library, for example a spring. This will look like:

Simscape code

Then we can begin defining our modes. In our modecharts, we need to define 3 sections: the modes,
the transitions, and the initial mode.

About the modes, in the case we are locked, the equation we want is the velocity between the two ports to be zero. In all the other modes, the equation we want is the force between the two ports to be zero.

modes

For the transitions, for each transition in the above diagram, we specify the source state, the destination state, and the condition when the transition should happen.

transitions

Finally, we can specify in which mode the simulation will start. If you do not specify one, the first mode defined will be used.

modes

Now that our component is complete, we can grab a Simscape Component block and specify the SSC-file we just created.

Simscape Component Block

To create a simulation similar to last week, we connect an Ideal Velocity Source to the base (this will be our moving base), and a Mass to the other port (this will be our box). Using Motion Sensor blocks, we can confirm that the motion is as expected.

The Model

The results

Now it's your turn

After going through the exercise of modeling this system in both Stateflow and Simscape, do you know what I conclude? I want an hybrid of both where I could create a Simscape modechart using the convenience of the Stateflow user interface. Wouldn't it be amazing?

Do you think such feature would be useful for you? Let us know in the comments below, along what you will do with Simscape modecharts.

Revisited: How Many Blocks are in that Model?

$
0
0

A long time ago, Seth wrote a post showing how to count the number of blocks in a model, including referenced models. At that time, using the functions find_mdlrefs to find all the referenced models and running sldiagnostics on each of them was the way to go.

In R2017b, Simulink Check introduces a new and easy way of finding out how many blocks are in a Simulink models, along with a lot of associated metrics: The Metrics Dashboard.

Block Count

To understand the sort of data that the Dashboard Metrics includes, I think it is a good idea to start with a simple model. For that, I will use the example model sf_car.slx. To get started, I launch the Dashboard Metrics from the Analysis menu:

Launching the Metrics Dashboard

Then I click the All Metrics button to begin the analysis:

Launching the Metrics Dashboard

Within the few seconds, I get the following report:

Launching the Metrics Dashboard

Let's click on some of those metrics to see what they can tell us. To begin, let's click on the number of blocks. This opens a table listing all the components in the model, and how many blocks they contain.

Block count

For example, we can see that the Transmission Subsystem contains 7 blocks, and 25 blocks including its descendants: Torque Converter (10 blocks) and Transmission Ratio (8 blocks).

Block count in transmission subsystem

More Metrics

In a way similar to the block count, the Metrics Dashboard can tell you how many and where in your model are the lines of MATLAB code (inside MATLAB Function blocks), lines of code inside Stateflow charts, and parameters.

More Metrics

In the above image, if I click on the number 10 in the System Interface section, I can see that the Engine subsystem uses 4 parameters from the base workspace:

Parameter Count

After verification, I confirm that the Engine subsystem really uses 4 parameters: 3 in the Engine Torque Lookup Table, and 1 in the Gain block

Parameter Count

Improving your model based on metrics

Now let's switch to a larger, more complex model. For that, I will use a hybrid electric vehicle example from the Powertrain Blockset.

One interesting metric for this model is the library reuse, which shows that many subsystems have identical copies in the model.

Library reuse

If you click on the metric to look at the details, you will notice a button saying Open Conversion Tool:

Conversion Tool

This will launch a tool that can in one click replace all the copies of the subsystem in your model by instances of one library block.

Clones

As you can imagine, doing this refactoring should help to avoid situations where you could modify one copy of the subsystem and forget to modify the other copies.

Now it's your turn

The Metrics Dashboard contains a lot more information, I recommend going through the Model Metrics documentation page to get the full list.

Try this new feature on your models and let us know in the comments below if you find something interesting. Also, let us know if there are additional metrics you are using and would like to see being included in the dashboard.

Viewing all 159 articles
Browse latest View live