Quantcast
Channel: Guy on Simulink
Viewing all 159 articles
Browse latest View live

Programming a PARROT Minidrone using Simulink

$
0
0

You know what I did this weekend? Yes, as the title of this post says, I deployed custom flight control software to my Parrot Rolling Spider Minidrone

Simulink Support Package for PARROT Minidrones

Last Christmas, my girlfriend got me one of those Parrot Rolling Spider Minidrone.

PARROT Mini drone

Immediately, I thought it would be cool to program it using Simulink. At that time, I did some research and it sounded pretty complicated to install a custom firmware and glue all the necessary code together.

Not anymore, with the recent release of the PARROT Minidrones Support Package.

Today I will describe my first experience using this package.

Installation

To get started, open the Add-On Explorer from the MATLAB toolstrip.

Add-on menu

In the Explorer, search for "PARROT Minidrone", click Install, and follow the instructions. Once the package is installed, the installer will guide you through the hardware setup.

This setup will first update the minidrone firmware. Notice that once the firmware is updated, you will not be able to fly the minidrone from the smartphone app anymore. As one of my colleagues likes to say: When you update the firmware, you are converting a toy into an experimental device.

Updating firmware

If you want to bring your minidrone back to "toy mode", you will need to go to the PARROT website and follow the instructions to reset the original firmware.

Once the firmware is updated, you will need to connect to the minidrone through Bluetooth. Once again, the Hardware Setup window will guide you through all the steps:

Connecting to the minidrone

First Test

The best way to get started with programming the minidrone is using the Quadcopter Project, included with the Aerospace Blockset. In MATLAB, type asbQuadcopterStart to open the example.

Quadcopter Example model

This example is a full simulation of a PARROT minidrone. As you can imagine, we will not generate code for this entire model. What we want is generating code for the model flightControlSystem.slx, which is referenced by the FCS block.

Quadcopter Flight Control Model

In the Simulink Project click on the shortcut named Set PARROT Target

Configure the model for PARROT drone

This will setup a few things in the model configuration to make the generated code compatible with the minidrone.

Configure the model for PARROT drone

In the model, click the Build Button to generate code. Once the code generation is complete, go to the MATLAB prompt to connect to the minidrone, and start execution of the code.

Starting the code

For a first test, the line p.setPowerGain(20) is probably a good idea. It will instruct the drone to use 20% of the power available. That way, the drone will not fly, but the motors will move to confirm that the code is running.

What's Next?

The way things work, the customized firmware expects a library with a specific function and signature. In the example model, there are two bus objects specified on the two root-level Inport matching this expected signature. As output, a vector of 4 power commands, one per motor, is expected.

Available Sensor

To familiarize yourself with all the sensors available, I recommend enabling MAT-file logging in the model configuration, and use To Workspace blocks in the model to log the sensors signals. After your flight terminates, you will then be able to exeute p.getMatFile to retrieve the logged signals from the drone and analyze them.

My First flight

Confirm that I could change the model and see the effect, I used a Signal Builder to command the drone to fly at a fixed height and move left and right. Here is what it looks like in action:

Now it's your turn

Install the Simulink Support Package for PARROT Minidrones and let us know if you are able to improve the stability of the flight controller, or implement cool features like line or target tracking using the downward pointing camera.

If you want to learn more on that topic, I also recommend registering for the upcoming webinar on Programming Drones with Simulink that will be held on December 7th.


Highlight To Source and Destination: A new way to navigate your model

$
0
0

In the United States, Thanksgiving weekend is probably the weekend where the roads are the busiest. For those of you who got stuck in traffic to visit family and friends this past weekend, I thought I should share one of my favorite new feature in R2017b: The enhanced highlighting to source and destination.

Thanks to this new feature, you can now navigate through the signal lines in a Simulink model like if you were the only car on a highway. And you know the best: There is no traffic and no speed limits!

Navigating through a Simulink model, with the Arrow Keys

In R2017b, click on any Simulink signal to see the options to highlight to source or destination. Click on one of those, and Simulink will turn into what I call "Navigation Mode". From there, you can use the keyboard arrow keys to control the highlighting. With the left and right keys, you can navigate to the upstream or downstream block:

Highlight Sources and desitnations

When multiple sources or destinations are available, use the up and down keys to toggle between the possible sources and destinations:

toggle ports

As you would expect, the navigation can take you inside and outside of subsystems and referenced models:

navigate subsystems

Now it's your turn

This feature saved me a lot of time while debugging models in the last few months. Give it a try and let us know what you think in the comments below.

Simulating the World’s longest Ultra High Voltage Transmission Line with Simscape Power Systems

$
0
0

This week, I am happy to welcome guest blogger Hao Chen who will describe how Simscape Power Systems can be used to simulate the world's longest (3324 km) Ultra High Voltage DC (± 1100 kV) transmission system with the largest transmission capacity (24000 MW) in China.

Hao Chen, Power Systems expert and guest blogger

Starting with an Example

Simscape Power Systems includes a lot of examples. For most systems you could model, there is probably an example that you could use as a good starting point.

In this case, we will start with the example titled VSC-Based HVDC Transmission System (Detailed Model).

VSC-Based HVDC Transmission System (Detailed Model)

This example illustrates a 200 MVA (± 100 kV) voltage source converter-based HVDC system with 75 km transmission distance. If you are interested in the detailed system configuration and control design, I recommend visiting this documentation page:

https://www.mathworks.com/help/releases/R2017b/physmod/sps/powersys/ug/vsc-based-hvdc-link.html

Modifying the Example

With a few modifications, you may easily upgrade this example model to any of your desired HVDC systems. For example, after making the following changes, we can get the aforementioned most advanced HVDC system:

  • Voltage and power ratings of transformers and AC filters in both converter stations
  • Transmission cable parameters

For example, for the transmission cabler parameters, this means changing the Line Length (km) from 75 to 3324 and increasing the number of pi sections accordingly in the dialog of the PI section Line block:

Inceasing the transmission line length

What to do with this model?

Starting from this specific model, you may accomplish the following typical tasks:

  • Active/reactive power and DC voltage regulation
  • Transient stability study under different disturbances

The following simulation results illustrate a steady-state operation/regulation of the system:

  • After the DC voltages (± 1100 kV) are established at Station 2 (Trace 1: 0 second ~ 1 second), 24000 MW active power and 0 MVAr reactive power are transmitted at Station 1 (Trace 2 and Trace 3: 1 second ~ 2 second)
  • At 2 second, the transmitted active power is decreased to 21600 MW
  • At 2.5 second, the transmitted reactive power is decreased to -2400 MVAr which implies that the AC system1 absorbs 2400 MVAr reactive power from Station 1
  • At 3 second, the DC voltages are controlled to be ± 1000 kV.

Simulation Resulots

What's Next?

You could easily expand this model to include other components like wind power plants in the AC system at the Rectifier Station side. For your convenience, Simscape Power System provides many wind turbine models including most popular configurations, such as fixed-speed induction generator-based wind turbines, doubly fed induction generator-based wind turbine, and fully rated converter-based wind turbines. Look at those examples for more details:

https://www.mathworks.com/help/releases/R2017b/physmod/sps/examples.html#d2e3515


Simscape and Operating Point Management

$
0
0

In MATLAB R2017b, we added capabilities to manage operating points for Simscape models.

In this post, I will show an example of how to use this feature, and describe the possibilities it introduces.

Getting an Example

To highlight this feature, I decided to use an example available on MATLAB Central made by my colleague Steve Miller: Scissor Lift Model in Simscape Multibody.

In case you were not aware, it is now really easy to get MATLAB Central examples. All you have to do is click on the Get Add-ons button in the MATLAB desktop.

Getting Add-Ons

In the Add-Ons Explorer, type what you are looking for, and once you found it, simply click Add To MATLAB.

Getting Add-Ons

Transient Response

As its name implies, this model simulates a scissor lift, where a hydraulic cylinder makes the lift go up and down. Here is an animation made using the Mechanics Explorer.

Scissor Lift Simulation

If you look accurately at the results, you will notice that at the beginning of the simulation, the platform falls slightly before the hydraulic pressure stabilizes to compensate gravity.

Initial transient response

For this model it is not a major issue, but for large models, this type of transient response can take a considerable amount of time because the solver needs to take many small steps to capture it accurately.

Capturing an Operating Point

To avoid losing time with the transient response every time we simulate the model, we will simulate the model for a two seconds once, until the transient is passed, and then create an operating point object using simscape.op.create that will become our starting point for the next simulation.

Programmatically, this looks like:

Creating and using an operating point

Results with operating point

Note that it is also possible to configure Simscape logging and Operating Point from the Simscape section of the model configuration.

What else?

It is important to point out is that the Simscape Operating Point is very flexible. This includes:

  • It is possible to add nodes, remove nodes, and modify nodes programmatically
  • If the model contains blocks without corresponding nodes, the block dialog specification will be used
  • If the operating point contains nodes without corresponding blocks in the model, those are ignored

Let's take for example this simple thermal liquid model.

Pipeline simulation

We can create an operating point from the logged data:

Pipeline operating point

Now, let's say we decide to add one more pipe:

Pipeline simulation

If you try simulating this model with the previously created operating point, it will simulate fine, however, the second pipe will start with the pressure and temperature specified in the block dialog. Instead, we could make a copy of the pipe node already existing in the operating point and add it to the operating point as a new node.

Pipeline operating point

And now the second pipe operating point will also be controlled from the operating point object.

What's Next?

Are you already using the Simscape Operating point feature? If not, get started with those documentation pages:

Let us know what you think of this feature in the comments below.

Who’s Calling?

$
0
0

Did you know that it is possible to visualize the calling of Simulink Functions using the Sequence Viewer? Let's see how that works and in what type of situations it can be particularly useful.

The Question

Here is a question I have recently been asked:

I have a Simulink model with a Simulink Function. The model contains multiple Function CAller blocks that can call this Simulink Function. The Simulink Function contains a MATLAB Function block. When I put a breakpoint in the MATLAB Code, I want to know from which Function Caller block originated the call.

Who's calling?

The Sequence Viewer

The answer is a feature I typically use when dealing with SimEvents and Stateflow: The Sequence Viewer.

Sequence Viewer

When the breakpoint in the MATLAB Function block will be hit, you will know that the last client in the list is the one calling. In this image, we are at simulation time t=1sec, and the client is CallerB:

Sequence Viewer

Now it's your turn

Are you using the Sequence Viewer in your daily workflow? If yes, tell us why and how in the comments below.

The Simulink Curling Simulator… Version 2018

$
0
0

For those reading this blog for a few years, you probably remember that during the 2014 Winter Olympics, we published a curling simulator implemented in Simulink.

With the Pyeongchang Winter Olympic coming soon, I decided to re-visit the Curling Simulator and see if it could be improved by taking advantages of new features.

Original Model

First, let's go with a short refresher of what we did in 2014. The main idea is that we created a MATLAB App where you can specify direction, force and spin of your throw. We then use Simulink to simulate the motion of the stones. While the simulation is running, you can click the sweep button and affect the friction between the stone and the ice.

The Curling simulator

At the top level, the model looked like the following, where we had a Second-Order Integrator block driven by a Subsystem entirely made of Simulink blocks. Using Switches, Logical Operator and Enabled Subsystem, we would detect when there is a contact between the stones and reset the Integrator with updated velocities.

Original Curling Simulator

Stateflow

Here is what the top-level of the model now looks like in R2017b.

Improved Curling Simulator

Yes, all the computation has been moved inside a Stateflow Chart! What is inside this Stateflow Chart? A Simulink State!

Improved Curling Simulator

In my opinion, this expresses more clearly that at every time-step, we call the Simulink Function detectHit to check if any stones come into contact. If a contact happens, we call the other Simulink Function contact to recompute the velocities of the stones and apply to the Integrator blocks inside the Simulink State.

Curling Simulator

Now it's your turn

Give a try at the improved 2018 Curling Simulator and let us know what you think by leaving a comment below.

Simulating the Olympic Ski Jump Competition

$
0
0

This week I am happy to welcome guest blogger Zack Peters to describe how he implemented the simulation of a ski jump, similar to the Men's large Hill Individual event of the PyeongChang Winter Olympics starting this Friday.

Introduction

In case you are not familiar with the Olympic Ski Jump competition, let's start with a video explaining what it involves:

In order to maintain consistency and safety for the jumpers, there are a set of thorough standards written by the International Ski Federation (FIS) regarding the shape/profile of the ski jump ramp. Here is a picture taken from the Standards for the Constructions of Jumping Hills document showing all the specifications of the ramp (typically called In-run) and landing area. In this document, you can find all the numbers and equations defining the shape shown in this picture:

Specifications of the ski jump ramp and landing area

The Implementation

As you can imagine, this system could be modeled in many ways. One option would have been to use a conditionally enabled subsystem for each phase of the jump, in a way similar to how we simulated the pole vault competition in the previous summer olympics. Another option would have been to use the new Simulink States inside Stateflow, like we used to simulate a box jumping on a table a few months ago.

For this post, I decided to implement the ski jump dynamics using the Simscape language. I thought it would be a good application to utilize some of the new features available in R2017b like modecharts and and Simscape Functions

Some Symbolic Pre-Work

First, let's draw the free body diagram of a body moving along the In-run:

Free Body Diagram

As mentioned above, the FIS standard gives a great description of the hill profile (a relationship in the form y=f(x)). From there I need the slope (theta) and the radius of curvature (R) to compute the normal force (Fn). This can be obtained by differentiating the hill profile twice. To help with that, I used the Symbolic Math Toolbox. In case you were not aware, the Symbolic Math Toolbox is now well integrated into the MATLAB Desktop through the MATLAB live script technology.

Slope derivations using Symbolic Math Toolbox

To bring the final result into Simscape language, I used the simscapeEquation function, also from the Symbolic Math Toolbox.

Using simscapeEquation

Modechart

In my Simscape component, I defined a modechart with 3 modes: In-run, airborne and landing:

modechart

and I defined the conditions at which the system switches from one mode to the next:

transitions

Simscape Functions

When looking at the above code, you might wonder what are those functions like "jumpPkg.jump.slope" and other similar. Those are Simscape Functions, introduced in R2017b.

These allow for improved readability of the component and reuse of utility components. I packaged these up in a directory structure that would break up separate equations for the In-run and the landing area, allowing me to give the equations the same name, but a different path. Here is what my package looks like:

My Package

Inside those functions, I used the equations derived using the Symbolic Math Toolbox. Here is an example for the slope of the In-run.

Slope Simscape Function

As you can see, the In-run has 3 separate sections implemented using an If/Else statement in the Simscape Function.

Here is an animation of the simulation results:

Ski Jump Animation

Now it's your turn

Anybody interested in adding more fidelity to our jumper model? Are there other Olympic sports you would be interested to simulate? Let us know in the comments below.

What’s New in R2018a!

$
0
0

MATLAB R2018a is now available, let's go through a few of my favorite enhancements to Simulink in this release.

Strings

It has been a long time since we added a new section to the Simulink section of the Library Browser. In this release, we are adding two!

The first one is called Strings. As its name implies, a new set of blocks is added to Simulink to manipulate strings. Since this is a big topic, I will very likely write a post dedicated to Simulink Strings soon.

For today, here is a picture of the blocks available to create and manipulate strings in Simulink.

Strings blocks

More Quick Insert Blocks

Since the Quick Insert capability has been released a few years ago, I almost never use the Simulink Library Browser anymore. Instead, I type block names in the Simulink canvas to add them to models. With that workflow, I have to admit that I often end up typing things like:

  • "inp" hoping to get a Inport block
  • "cos" hoping to get the Trigonometric Function block configured for the cosine operation
  • "and" hoping to get the Logical Operator block configured for AND
  • "floor" hoping to get the Rounding block configured to floor
  • "log" hoping to get the Math function block configured for log
  • "one" hoping a Constant block outputting a value of 1

Good news! All the items on that list now work with Quick Insert!

Quick Insert One

Look at the Library Browser to see the list of blocks added to the Quick Insert list:

List of Quick Insert block

Simulation Pacing

For many years, we have been offering various options to make a Simulink model run in real time. This includes Simulink Real-Time, which allows you to generate code from a Simulink model and run it in real-time on a dedicated machine. This also includes Simulink Desktop Real-Time, which also generates code, but can run in real-time on the same Windows or Mac machine as MATLAB is running.

In R2018a, we are adding to Simulink a more lightweight pacing option. It cannot speed up your model if it is running slower than real-time like the two options above. However, if your model is running very fast and you would like to simply slow it down to something close to real-time, this option is for you.

I personally find this feature very useful when a user is supposed to interact with the simulation while it is running, for example through a MATLAB App.

To enable pacing, from the Simulation menu click on the Pacing Options entry:

Pacing Menu

In the pacing dialog, enable the pacing and select how fast relative to real-time you want the model to run.

Pacing Menu

Sample Time Legend

If you are like me and often dealing with multi-rate models, you probably ended up at some point spending more time than you would have like to searching deep down a hierarchy of subsystems for one block running at an unexpected rate. If this is the case, you will enjoy this enhancement.

In addition to a new look and feel, the Sample Time Legend now allows you to highlight blocks executing at a specific rate.

Sample Time legend and Highlighting

Port Connection Cues

I never thought I would say this, but no need to drag lines to connect blocks anymore!

In R2018a, when you click on a port, Simulink immediately highlights ports to which it could potentially be connected to in its surroundings. You can then click on the desired port and the connection is made using what we consider the most optimal route.

For Simscape blocks, only ports of the same domain are highlighted.

Port Connection Cues

Flexible SimState Restore

As you probably know, before R2018a, it was possible to save the SimState of a simulation at a specific time and restart the simulation from this point. This is very useful if you need to run multiple simulations that have an identical initialization phase, and then diverge after some time. A good example of that is a plane taking off always in the same way, but doing different maneuvers while in the air.

SimState

One of the main restrictions in that workflow was that it was impossible to modify the model before restarting the simulation. In R2018a, we decided to relax this limitation and allow some modifications to help debugging.

The modifications allowed to the model should not change simulation results, but will allow you to gather more information. This includes adding or removing Scope blocks, Display blocks, To Workspace blocks and To File blocks. We also allow changing which signals are logged.

As far as I can see, this enhancement will help me avoid situations where I wait for a long time for a simulation to complete to finally realize, "Oh no! I should have logged that signal too!"

Hit Crossing Messages

Recently, I have been playing more and more with SimEvents and Messages in Stateflow. Those offer some pretty interesting and powerful semantics.

When modeling hybrid systems combining continuous dynamics and event-based logic, the new option of the Hit Crossing block to output a message can be very useful.

Hit Crossing Message

For a more complete example, I recommend looking at the SimEvents example seExampleTankFilling

Now it's your turn

Have a look at the Simulink R2018a release notes and let us know what is the most important addition for you, and which features you would like to hear about on this blog.


MATLAB Online, MATLAB Mobile, MATLAB Drive… and Simulink

$
0
0

I have never written about these topics on this blog because this is not specific to Simulink, but... I am a big fan of MATLAB Online and MATLAB Drive. Today I will describe how I use these and highlight what you can do with them.

MATLAB Drive

In case you did not know: If you have a MathWorks account, you have access to MATLAB Drive!

How do you access it? Let's begin with the method I use the most: MATLAB Drive Connector.

You can install MATLAB Drive Connector from this link. Once this is done, you will see a MATLAB Drive Connector icon in the taskbar, and clicking on it will allow you, for example, to see file activity and quickly navigate to your MATLAB Drive folder.

Note: I am using on Windows, but this is also available for Mac and Linux.

MATLAB Drive Configuration

Another option is to access MATLAB Drive through a web browser, where you will be able to upload and download files:

MATLAB Drive Webpage

I recommend looking at MATLAB Drive help for more details.

MATLAB Online

Another feature that works in combination with MATLAB Drive is MATLAB Online, which is also included with most license types. With MATLAB Online, your "working directory" is MATLAB Drive.

MATLAB Online offers limited support for Simulink. You cannot edit models, but you can simulate them as mentioned here.

MATLAB Onlinee

MATLAB Mobile

MATLAB Mobile is another way to run MATLAB and simulate models. If you are not using it already, you can get it from Google Play or Apple App Store righ now.

Here is a screenshot of my iPad simulating a model:

MATLAB Mobile

Advantages

One obvious advantage of simulating models using MATLAB Online or MATLAB Mobile is that the computation is done online. This keeps your computer CPU available to do something else.

Another feature I really like is that your session is continuous. You can connect and disconnect interchangeably between MATLAB Online and MATLAB Mobile and the same session continues. This means I can start a simulation from MATLAB Online at work, disconnect and check on it later from MATLAB Mobile.

The last thing I want to highlight is that you can publish a script as HTML or PDF and share the address with anybody, even if they do not have a MathWorks Account.

Publishing using MATLAB Online

You can see the results of my simulation above by visiting this link:

https://matlab.mathworks.com/users/guirlo/Published/simMyModel/index.html

Here is what it looks like:

Published Result using MATLAB Online

Now it's your turn

Are you using MATLAB Online, MATLAB Mobile or MATLAB Drive? Let us know how in the comment below.

One final thought... If you enjoy running simulations online instead of on your computer, I also recommend looking into the options for Parallel Computing on the Cloud. This will allow you to scale up and run tons of simulations in the cloud at the same time.

Communicating with an External Application for Co-Simulation

$
0
0

Today I am describing an example that I recently submitted to MATLAB Central and GitHub with the help of my colleague Haihua Feng: Example implementation of Co-simulation using Simulink.

In case you did not know, MathWorks' website lists a lot of third-party modeling and simulation tools from MathWorks Connection Partners.

MathWorks Connection Partners

Many of them offer the option to do Co-simulation with Simulink. With such solutions, those third-party tools allow their users to design part of their algorithms in the third-party tool (usually a specialized domain for which MathWorks does not have a dedicated toolbox), and part of it in Simulink (for example designing a controller for which you want to generate embedded code).

If you are the author of such a tool or would like to integrate your tool in Simulink for co-simulation, I recommend going through this post in details.

The Project

Once you have downloaded the submission from MATLAB Central or cloned it from GitHub, open the Simulink Project SimulinkCoSimulationExample.prj. In the Shortcuts tab, you will notice that I added shortcuts to help you go through the steps you will need to follow to run the examples.

Co-simulation project

Those steps include:

  • Download and build the ZeroMQ library
  • Build a co-simulation server executable
  • Build a S-function to communicate with the server executable

Let's look at those steps in more details.

ZeroMQ

To implement the communication between Simulink and the other software, we decided to use a library named ZeroMQ. I could try myself to describe what ZeroMQ is, but I thought the best would be to quote the ZeroMQ manual description of how it began:

We took a normal TCP socket, injected it with a mix of radioactive isotopes stolen from a secret Soviet atomic research project, bombarded it with 1950-era cosmic rays, and put it into the hands of a drug-addled comic book author with a badly-disguised fetish for bulging muscles clad in spandex. Yes, ZeroMQ sockets are the world-saving superheroes of the networking world.

See the full manual for more details.

Installing ZeroMQ

In my opinion, the easiest way to get the library is through GitHub. You will need two GitHub entries: cppzmq and libzmq.

In MATLAB, if you already have set up Git source control, you can clone the repositories from the Current Folder browser. If you prefer, you can also simply clone the repositories by calling the Git command-line client directly from the MATLAB prompt.

Cloning zmk git repositories

Once this is done, you need to build the library. For that, you will need a compiler. In my case, I used Microsoft Visual Studio 2015, so I launched the command prompt from Visual Studio:

Launching MSVC command prompt

I navigated to the build folder of libzmq and executed the provided build batch script:

Building ZMQ

As you can imagine, there are many ways of building the library for various OS and compilers, see the ZMQ documentation for the options available for your particular setup.

Once the library has been built, it needs to be added to the system path. If you are in my Simulink Project, the shortcut SetEnvVariable will do it using the setenv function.

The Server Application

The next step is creating a server app. In this example, the server app implements a simple algorithm: an exponentially weighted moving average. At every time step, Simulink will send data to the server, the server will do some math and send the results back to Simulink.

The main file of the server app is statcalserver.cpp. If you go through the code, what you will find is a simple example that first binds to a socket (a specific IP address and port). Then it goes in a loop where it waits for a request from the client. When a request comes in, it decodes the data associated with it, processes it and sends the reply to the client. Here is a snippet of the server code:

Server Code

In the Simulink Project, look at shortcut buildCoSimExample to see how the mex command can be used to build the server app.

The Client

On the Simulink side, the client is implemented using a C-Mex S-function (In fact it is a C++ S-function). Let's look at the most important parts.

At the beginning of the simulation, we use mdlSetupRuntimeResources to open the connection with the server. We store in a pointer work vector the information related to this connection.

Setup Resources

One important thing to note is that for maximum performance, we made the input of the S-function non-directfeedthrough. That way the S-Function does not use its input at the current time step to compute its output. As you can imagine, this introduces a delay, but this allows Simulink to not wait for the server to respond before moving forward and execute other blocks in the simulation.

To make that work, we send the request to the server after all block outputs have been computed, in mdlUpdate.

mdlUpdate

and at the next time step, in mdlOutput we retrieve the response from the server and output it.

mdlOutput

Finally, when the simulation is over we close the connection in mdlCleanupRuntimeResources

Cleanup Resources

In the Simulink Project, look at shortcut buildCoSimExample to see how the mex command can be used to build the S-Function.

To learn more about the available callback methods in an S-Function and when they are called, I recommend looking at Simulink Engine Interaction with C S-Functions.

The Final Result

As mentioned above, in the Simulink Project I created shortcuts to MATLAB scripts to help with all the steps leading to here.

Once you have the libzmq DLL built and on the OS path, the server executable built, and the S-function mexed and on the MATLAB path, you should be able to launch the server. In the Simulink Project, you can use shortcut startCoSimServer, which will execute the following code:

Launch Server

With the server running, we can finally simulate the example model clientModel.slx and observe the results:

Co-Simulation model

Now it's your turn

If you are considering implementing a co-simulation with an external application, give a try to this technique and let us know how that goes in the comments below.

Simulation Data Inspector in R2018a

$
0
0

Over the past few releases, many enhancements have been added to the Simulation Data Inspector. Let's look at a few of those I particularly like.

Browse Mode

By default, in the Simulation Data Inspector you select which signals are displayed by checking and unchecking a checkbox for each signal, or by dragging them on the axis onto which you want to plot them. Here is what it looks like for a simple example model.

Select Mode

While this can be useful for some workflows, when I debug models, what I usually need is to scan a large number of signals as fast as possible. For that, we introduced Browse Mode. Here is how to enable Browse Mode:

Choose Browse Mode

Now I can use the arrow keys to browse the signals, along with Ctrl and Shift keys for multi-selection like in most applications. Here is me browsing logged signals for the same model:

Browse Mode

See this documentation page for more information on Browse Mode

Simscape Enhancements

In R2018a, we added the possibility to directly record Simscape data in the Simulation Data Inspector. This can be enabled from the Simscape section of the model configuration:

Choose Browse Mode

Another capability that has been added to the Simulation Data Inspector is the possibility to visualize logged data in different units. If I enable the Units column in the signal list, I can see a list of commensurate units from which I can choose from.

Here is one more animation to demonstrate this feature. I have Simscape data logged in the Simulation Data Inspector, I chose to hide the column showing the line color, I enabled the Units column, and I grouped the signal using the Physical System Hierarchy, in Browse Mode:

Simscape data in SDI

Now it's your turn

Please share any features you use to improve your workflow in the Simulation Data Inspector in the comments below.

New Capabilities for Block Masking

$
0
0

Earlier this week, I had to debug an issue related to a block mask in MATLAB R2012b. This made me realize that I have not written about masking in a long time.

So many capabilities have been added in the last few years, I decided to highlight some of them in this post.

MATLAB R2012b

To begin, let's step back to five years ago. Here is what the Mask Editor looked like in MATLAB R2012b. At that time, all you could do was specify parameters one after the other, and the types available were limited to pretty much only edit, checkbox and popup.

Mask Editor in R2012b

MATLAB R2013b

In MATLAB R2013b, the Mask Editor was redesigned to allow more flexibility. Here is what it looked like:

Mask Editor in R2013b

This redesign allowed things like:

  • Specify location of the prompt (same or different row)
  • Place multiple parameters on one line
  • Group parameters within containers and tabs
  • Add action items like buttons and hyperlinks
  • Add images

Here is an example of what a mask dialog can look with those additions:

Mask example in R2013b

MATLAB R2018a

Now let's move forward to R2018a. As you can see, many new parameter and container types have been added:

Mask Editor in R2018a

Here is an example using dials, sliders, and the table container.

Mask example in R2018a

What's next?

To see examples of best practices when creating masks, I recommend typing slexMaskingExample in MATLAB or visit the Masking Example Models documentation page.

Here is an example I just put together to highlight how to modify images and text elements based on the choice of a popup parameter:

Dynamic Mask example in R2018a

To make it happen, I specified the following code in the parameter callback of the popup parameter:

Dynamic Mask example in R2018a, the code

Debugging Tip: While developing mask callback code, store it in a MATLAB script, and call this script from the Mask Editor. This will allow you to put breakpoints and debug your code easily.

Now it's your turn

Share your masking tips and experiences in the comments below.

Visualizing Fixed-Point Algebraic Loops

$
0
0

A few days ago I had to debug a very large model generating an error similar to the following:

Algebraic Loop Error

In my case, the loop involved more than a hundred blocks and signals spread everywhere in the model and combined in buses, which was making it complex to analyze.

ashow (And why you don't need it anymore!)

For many years, I have been using the ashow function to highlight algebraic loops. Here is an example of how it works for a simple model:

Algebraic Loop highlighted by ashow

However, in addition to a few usability challenges, one major difficulty with ashow is that it can only highlight a subset of algebraic loops - and, of course, it cannot highlight the one I needed to solve.

The limitation affecting me was that the algebraic loop was made of fixed-point signals. This led to a sort of chicken-and-egg problem. For ashow to work, it needs the model to be compiled. But since the loop is made of fixed-point signals, the Simulink engine knows that it cannot solve the loop, and errors out during model compilation, making it impossible to use ashow.

That's when I remembered a relatively new function that I tend to forget: Simulink.BlockDiagram.getAlgebraicLoops

Simulink.BlockDiagram.getAlgebraicLoops

If you read the documentation page on algebraic Loops attentively, you might have noticed that Simulink now offers the function Simulink.BlockDiagram.getAlgebraicLoops, a more modern and powerful way to highlight algebraic loops.

For the same example as above, here is what it looks like:

Loop highlighted using Simulink.BlockDiagram.getAlgebraicLoops

This function was introduced in R2015a, and in R2017b it was enhanced to be able to find and highlight more types of algebraic loops. In my case, it allowed me to highlight a loop made of fixed-point signals. Seeing the loop allowed me to figure out the best place to introduce a delay and break the loop.

A few things to note:

  • The block highlighted in red is what we call the algebraic variable. Introducing a delay at the output of this block is probably a good first thing to try to remove the algebraic loop (Unless the loop is continuous, as explained in this post).
  • If we detect that the loop is artificial, it will be highlighted with a dashed line, meaning that you should fix it using the Minimize Algebraic Loop feature of Atomic Subsystem or Model Reference.
  • Simulink.BlockDiagram.getAlgebraicLoops also returns an output object with properties of the loops in the model, including handles to the blocks involved, which you can use at your convenience.

Here is an example of a fixed-point model with an algebraic loop highlighted:

Loop highlighted using Simulink.BlockDiagram.getAlgebraicLoops

Now it's your turn

Are you struggling with algebraic loops? Does using Simulink.BlockDiagram.getAlgebraicLoops help you understanding them better? Let us know in the comments below.

Continuous Integration with Simulink Project and Simulink Test

$
0
0

A few days ago, my colleague Mariano published a blog post on the Developer Zone describing how to run a MATLAB Test suite on a Continuous Integration server every time changes are pushed to a Git repository branch.

As you probably guessed, as soon as I saw that, I had to implement it in a Simulink context. Let's see how that went.

The Big Picture

Here is the big picture of the workflow:

Simulink Project-Git-Jenkins workflow

The main steps are:

  • We have a Simulink Project with source control integration configured to a GitLab repository
  • In the Simulink Project, we have a test suite created using Simulink Test
  • Every time we commit and push changes to a specific branch of the Git repository, the remote repository notifies a Jenkins server
  • As soon as it gets notified, the Jenkins server pulls the commit, launches MATLAB, opens the Simulink Project and runs the Simulink Test test suite
  • If the test passes, the Jenkins server creates a merge request in GitLab.
  • If a test fails, the Simulink Test results are saved and a bug issue in GitLab is created.

This last step of saving the Simulink Test session is very important. As you will see below, it allows me to analyze the simulation results locally without re-running the failed test, saving me a lot of time if the simulation I am testing takes a long time to simulate.

Now it's time to go into the details.

Some Background

Here is a quick recap of the steps to go through outside the MATLAB environment, in Jenkins and GitLab. See Mariano's post for more details:

  • In Jenkins, specify the repository URL, the branch to build and my credentials
  • In Jenkins, set Build Trigger to build when a change is pushed to GitLab
  • In Jenkins, specify the build command to launch MATLAB and run my tests
  • In GitLab, setup a Push Event Web hook to the GitLab CI Service URL of Jenkins. This will be triggered every time I will push changes to my testing branch
  • Now let's move to the fun stuff :-)

    Simulink Project

    For this example, we will reuse the same example we used before in this post where we tested that the results of a simulation was matching results from a generated executable using Software-In-The-Loop simulation:

    Simulink versus Software in the loop validation

    The post Simulation Based Testing with Simulink Test Manager describes in detail how to set up the test, so I will not repeat it here.

    What I added for this blog is to create a Simulink Project, adding all the files to it and configure the source control integration.

    Source Control Integration in Simulink Project

    Running the Simulink Test test suite on the Jenkins Server

    In Jenkins, we need to specify a build command. This build command will launch the MATLAB executable in "nodisplay" mode and use the -r flag to run some MATLAB code (See this image). In my case, the MATLAB code is:

    Jenkins Build command

    The function runMyTests is similar to the one presented in Mariano's post. Here is what it looks like:

    running the tests

    Things to notice:

    • The tests are run through the MATLAB Testing Framework. Thanks to that, my test suite can include tests created using Simulink Test and using the MATLAB Testing Framework. As they say where I come from: A test is a test!
    • The functions writeMergeRequest() and writeIssue() contain code similar to Mariano's post, using webwrite to create a merge request or an issue in GitLab using its API.
    • I create a folder to store the results in case of failure
    • sltest.testmanager.exportResults is used to save the test results in case of a failure.

    Inspecting Test Failure

    Depending on how your Jenkins server is configured, you could write MATLAB code to put the test results at any place convenient for you. By default, I can go grab my results file in the Jenkins workspace.

    Getting the results

    Once I get the results file, I can simply double-click on it in MATLAB and the Test Manager will show what went wrong.

    Visualizing the results

    I will repeat it... since I often deal with simulations that take hours to run, getting the results file from the server saves me a lot of time since I do not need to re-run the simulation on my machine.

    Now it's your turn

    Are you incorporating change management and continuous integration tools like Git and Jenkins in your team-based Model-Based Design projects? If yes, tell us more about your setup in the comments below.

Optimizing Data Types with the Fixed-Point Tool

$
0
0

Have you ever had one of those days... ?

Two minus one

The Explanation

When I see things like that, my first reflex is usually to turn on most of the items in the Display menu. In this case, displaying the port data types helps a bit with understanding what is happening:

Show Port Data Type

In this case, the data type of the output signal is sfix16_E1. This means that it is a 16 bits integer with a fraction length of -1. See the documentation for fixdt for more information on the possible ways to specify fixed-point data types in Simulink.

This data type, sfix16_E1, can only represent 0 and 2, not 1. This is why the output is zero.

Why?

Now... you are probably wondering why the data type of the Sum block is sfix16_E1.

First, let's look at its block parameters:

Sum block dialog

As you can see, its output data type is set to "Inherit via internal rule". When the time comes to automatically choose a data type, Simulink has to make a trade-off between range and precision. In most cases, by default Simulink will tend to favor range over precision. In this case, the fraction length of -1 is the most precise option allowing the Sum block to cover the entire potential range of the sum of the input signals data type.

If you want us to find a better trade off, here are two options using the Fixed-Point Tool, a very useful tool included with Fixed-Point Designer.

Fixed-Point Tool - Simulation Workflow

Right-clicking in the model window gives you the option to launch the Fixed-Point Tool. If you click on the Collect Ranges, it will simulate the model and collect data about the ranges of signals in the model.

Collect Ranges

Note that you have many options when collecting ranges, like aggregating results from multiple simulations and using double data type during the collection.

Once this is done, click Propose Data Types

Propose Types

And now magic happens!

You can inspect the proposed types and decide whether to accept each one individually. In my case, I accepted the data type proposed for the Sum block output, which was ufix16_En15.

Apply Types

After I apply the results, I simulate the model again and get the desired result: 2-1=1.

Fixed model

Fixed-Point Tool - Range Analysis Workflow

If you know the ranges that the signals in your model are expected to take, you can specify them in block dialogs and those ranges will be used:

Specify Ranges

In the Fixed-Point Tool, click on Derived Ranges to use those values.

Derived Ranges

Once this is done, follow the same workflow as above: Collect, Propose, Apply. We'll take care of the rest!

Now it's your turn

Are you taking advantage of simulation results and specified ranges to optimize fixed-point properties in your models? Let us know in the comments below.

If you are not using it already, I recommend reading more about Fixed-Point Designer. What I showed in this post is only a small example of what it can do for you.


What’s New in R2018b!

$
0
0

MATLAB R2018b is now available! In this first post about R2018b, I decided to highlight enhancements to the Simulink editor that will hopefully speed up model creation.

Group Block Rotation and Flip

I reorganize models all the time, and I am picky on the style. This means that I often need to flip and rotate blocks. Before R2018a, I was running into situations like this one very often:

Flipping group of block before R2018b

See how easier it is in R2018b. Now when I select a group of blocks and hit Ctrl+I, the entire group flips:

Flipping group of blocks in R2018b

Connect Blocks More Quickly

In R2018b, if you click on a port, compatible ports are highlighted, and you can click on one of them to make the connection. No more need to hold the mouse and drag.

Connecting ports

Add Ports More Easily

When hovering over the edge of blocks that can have multiple ports, you now have the possibility to create new ports. Here is an example using a Subsystem and a Bus Selector.

Port Sprouting

A smarter quick insert

We added a few mechanisms to help the Quick Block Insert feature to provide smarter suggestions. The first one is that it learns the blocks you use the most and ranks them higher.

To highlight the effect of this feature, in the next image I show the result for typing "si". In R2018a, I often ended up inserting mistakenly the Sine Lookup Table block instead of the Sine Wave source block. After using R2018b for just a few days, it now knows that I use the Sine Wave source block more often and ranks it higher.

Smart insert based on history

See this documentation page if you want to customize the way the algorithm learns. For example, the function slblocksearchdb.trainfrommodelsindir can scan all the models in a specific folder and use them to train the algorithm.

If you drag a line from a port, you can now double-click on its unconnected end and you will get a list of the blocks most likely needed next. For example, after a Gain block I am likely going to do more math like additions and subtractions. For a Mux block, I am more likely to use blocks like Rate Transition or Signal Conversion.

Contextual smart suggestions

See how it helps me creating a Mass-Spring-Damper system without typing anything and without opening the library browser.

Quick Insert in context

Edit and Tune Parameters Without Opening Block Dialog

For some blocks, we added the possibility to edit and tune parameters without opening the block dialog, directly in the canvas. This works both during edit-time and while the simulation is running.

Tuning Parameters in canvas

Simscape Buses

As requested by many users, it is now possible to combine multiple Simscape connections into one bus. Notice in the following animation how the Simscape Bus block leverages many of the enhancements mentioned above. You can configure it entirely from the canvas, without opening any dialog box.

Simscape Buses

Now it's your turn

Did you already go through the R2018b release notes? Let us know in the comments below what is your favorite new feature and which ones you would like to see described on this blog.

Arduino Engineering Kit

$
0
0

Have you heard of the Arduino Engineering Kit?

If you are interested in DIY projects and are looking for a fun way to apply some control and robotics principles to a real system, you probably want to read this post.

Introduction

If you have been following this blog for some time, you are probably aware that I like using MATLAB and Simulink for various projects at home. For an example, see my sous-vide cooking machine posts.

When I heard that Arduino is now offering an Arduino Engineering Kit and that we have support packages to program it with Simulink, I contacted the team that put it together and asked if I could borrow one to play with it a bit.

When you buy the kit on the Arduino Store, you receive a box full of mechanical and electronic parts, including a Arduino MKR1000:

The Arduino Kit

The kit includes instructions to build three possible projects: a motorcycle, a rover, or a drawing robot.

The 3 projects in the Arduino kit

I decided to go for the motorcycle. I thought the inertia wheel making it self-balancing would be an interesting control project.

Getting Started

Once you have the kit pieced together, you will need to install a few packages in MATLAB:

The easiest way to install those is through the Add-ons menu in the MATLAB toolstrip.

After installing those three packages, I went in the examples folder of the Arduino Engineering Kit Hardware Support package and tried the examples one by one, to be sure I was able to utilize all the sensors and actuators. For example, here is my test of the IMU, where I tilted the motorcycle by 90 degrees back and forth along all axes. This allowed me to conclude that the axis I want to control, the roll angle of the motorcycle, is the second element of the Euler angles output, the Y axis.

Testing the IMU

My Model

The Engineering Kit Project Files also contain a complete model that balances the motorcycle and allows you to control its speed and steering angle. However I thought it would be more fun to build mine from scratch. If you are interested, you can download the final version here.

Here is a picture of the top level of the final result.

Top final model

Let's look at each of the components. To begin, on the left I created a subsystem with all the sensors I needed and combined them in a Bus.

Top final model

Next I process each sensor to extract the relevant data in convenient engineering units.

Top final model

Now it is time for the Stateflow chart acting as the brain of my model. On the left, I check for three conditions: That the IMU is calibrated, that the motorcycle has not fallen, and that the flywheel does not reach maximum speed. When all those conditions are met, I can then click the Start button at the top level of the model. Once this is clicked, I have 4 seconds of calibration where I hold the motorcycle perfectly vertically for calibration before I start the balancing. If the motorcycle falls, I can hit the button again to reset the controller and try again.

Top final model

When the chart enables the balancing, it turns on an Enabled Subsystem that activates the controllers. For the balancing fly-wheel, the controller is a PID that takes as input the roll angle of the motorcycle and generates a voltage command to the fly-wheel. For the motorcycle speed, this is a simple proportional controller, which takes as input the speed of the motorcycle, integrates it and compares it with the wheel encoder.

Top final model

Note that this balancing controller is not perfect. The sensors on the fly-wheel motor do not allow direct measurement of the fly wheel velocity, making it difficult to control the fly-wheel motion perfectly. We are working on that!

Finally, the output of the controllers is sent to the output driver blocks.

Top final model

And it works!

Here is a video showing the motorcycle in action:

Visit the Arduino Engineering Kit YouTube channel to see more examples.

Now it's your turn

Let us know what you think of the Arduino Engineering Kit in the comments below.

Help your friends and colleagues learn Simulink with Simulink Onramp

$
0
0

Have you heard of Simulink Onramp?

If you visited matlabacademy.mathworks.com recently, you probably noticed that MATLAB Onramp has a new friend!

MATLAB Academy

If you are new to Simulink or you have friends or colleagues that are looking to learn the basics, Simulink Onramp is for you!

Installing Simulink Onramp - Method 1: Add-on Manager

First, I need to mention that Simulink Onramp works with MATLAB R2018b. If you do not have it installed, download it here.

The simplest way to install Simulink Onramp is from the Add-on Manager. To start, click on Get Add-Ons from the MATLAB Toolstrip:

Getting Add-ons

In the Add-on Manager, search for Simulink Onramp:

Found it!

Once you found it, click the Add button and you should be all set.

Adding it!

Installing Simulink Onramp - Method 2: MATLAB File Exchange

If, for some reaons, you cannot install Simulink onramp from the Add-on Manager, here is another option.

Go to MATLAB File Exchange and search for Simulink Onramp. This will allow you to download Simulink Onramp as a MATLAB Toolbox

Downloading MATLAB Onramp

Once the download is complete, in MATLAB, navigate to the directory where you saved the toolbox and, in the Current Folder window, right-click on SimulinkOnRamp.mltbx and select Install.

Installing MATLAB Onramp

Launching Simulink Onramp

To begin, launch the Simulink Start Page by clicking on the Simulink icon in the MATLAB toolstrip:

Launching Simulink Start Page

In the Simulink Start Page, you will see a new Learn section in the bottom left corner:

Launching MATLAB Onramp

Ramping up

Simulink Onramp contains 14 sections.

MATLAB Onramp sections

The first sections will guide you through basic things like implementing simple algorithms and inspecting results. For each section, Simulink will open models with a new Tasks pane on the left and an Assessment pane on the right. Those will guide you through the exercises, submit your answers and confirm that you have completed the tasks successfully.

MATLAB Onramp Algorithm

As you can see, the first tasks are very simple to grasp the basic of Simulink. In the above image, section 4.1 asks you to compute the square root of a signal.

More Complex Projects

As the problems evolve, you will be asked to solve problems of increasing complexity. Diagrams and quizzes will help you through those. In the final section, you will implement a simplified simulation of a Peregrine Falcon diving, including the initial acceleration and the sudden braking when getting close to the ground.

MATLAB Onramp Falcon problem

Now it's your turn

Give Simulink Onramp a try and let us know what you think in the comments below. If you are already a Simulink expert, would you like to see other types of onramps for other products and other applications? Controls? Signal Processing? Let us know!

Internal Combustion Engine Ignition Control Example – Part 1

$
0
0

This post introduces an example project I recently submitted to MATLAB Central: Four-Cylinder Engine Ignition Control Simulation

This project was made in collaboration with Isaac Hisahiro Ito at Toyota Motor North America R&D. Inside this project, you will find:

This project is for educational purposes, with the objective of demonstrating how the listed products can be used together.

In today's post, I am describing the modeling of the engine and drivetrain. I will follow up next week with a post describing the controller implementation.

Overview

This image illustrates the succession of events in this project.

Project overview

  • The engine crankshaft is equipped with a toothed wheel. In this case, the teeth are equally spaced every 10 degrees, with one missing tooth.
  • When the crankshaft rotates, the teeth pass in front of a sensor that triggers an interrupt, executing code on the ECU.
  • The code computes the position and speed of the engine and determines when the next cylinder should fire.
  • The code sets a hardware timer that will fire the appropriate spark plug at the appropriate time.

The next plot shows when the spark plugs are fired for each cylinder during one combustion cycle.

Cylinder Spark signals

Getting Started

For convenience, all the files involved in the project are included in a Simulink Project. When you open the project, a shortcut to the main model appears:

Simulink Project Shortcut

Here is what the main model looks like.

Main Model
Click image to enlarge

To document what each Subsystem is doing, I use Notes. Notes are a convenient way to add rich text, equations, and images to a model. You can open and close the Notes from the View menu or by hitting Ctrl+Shift+N. In case you had not noticed, you can click and drag the title bar of the Notes to move it to the top, bottom, left or right. You can even undock it from the canvas.

Engine Design using the Symbolic Math Toolbox

Inside the Subsystem containing the engine model, you will see that the Notes provide hyperlinks to a series of MATLAB LiveScripts that my collaborator Isaac created to design the engine model:

Notes to MLX

In those files, Isaac generated MATLAB functions and Simscape equations directly from the Symbolic Math Toolbox. Here is an example computing the cylinder volume as a function of the crank angle.

Symbolic Math toolbox

Four-Cylinder Engine Implemented using Simscape Language

To incorporate his design in Simulink, Isaac used the Simscape language. Using Mode Chart Modeling, he implemented equations for each phase of the combustion cycle: intake, compression, expansion and exhaust.

Simscape Modechart

In addition to a cylinder component, Isaac also implemented an intake component, allowing to control the airflow going in the engine using a throttle valve, and an exhaust component.

Here is what the pressure in the cylinders looks like over the course of a single combustion cycle..

Cylinders Pressure

To assemble the engine, we connected the intake, the four cylinders and the exhaust components together using physical connections inside a Subsystem. I then used the new R2018b function subsystem2ssc to convert this Subsystem into a Simscape composite component, which we could then include in the model using the Simscape Component block. This enables us to have all the engine parameters in one convenient dialog.

Simscape subsystm2ssc

Drivetrain Modeling using Simscape Driveline

To add a load for the engine, I used Simscape Driveline blocks like Torque Converter, Clutch and Planetary Gear to model the drivetrain. I recommend looking at the Complete Vehicle Model example for a well documented similar implementation.

Simscape Driveline

Vehicle Body

For the Vehicle body, I decided to implement two versions using Variant Subsystems

Because Isaac implemented the engine model using Simscape, I made the first implementation using Simscape Driveline:

Powertrain Blockset Vehicle

For the second implementation, I thought it would be a good opportunity to showcase the existence of the new product released in R2016b, Powertrain Blockset. This product does not (yet!) have an engine model suitable for this application, but it includes a library of components for simulating engine subsystems, transmission assemblies, traction motors, battery packs, and so on.

Here is how I interfaced the Vehicle Body 1DOF Longitudinal to the rest of the Simscape network:

Powertrain Blockset Vehicle

I recommend that you take a look at the library of fully assembled reference application models of automotive powertrains, including gasoline, diesel, hybrid, and electric systems included with the Powertrain Blockset.

Now it's your turn

In my next blog post, I will describe the remaining model architecture.

In the meantime, I would love to hear from you. Post your comments or questions below.

Internal Combustion Engine Ignition Controller Example – Part 2

$
0
0

In my previous post, I introduced an example I recently published on MATLAB Central: Four-Cylinder Engine Ignition Control Simulation.

After describing how the plant model has been implemented, it is now time to describe how the controller is implemented, and how the overall system is simulated.

The Big Picture

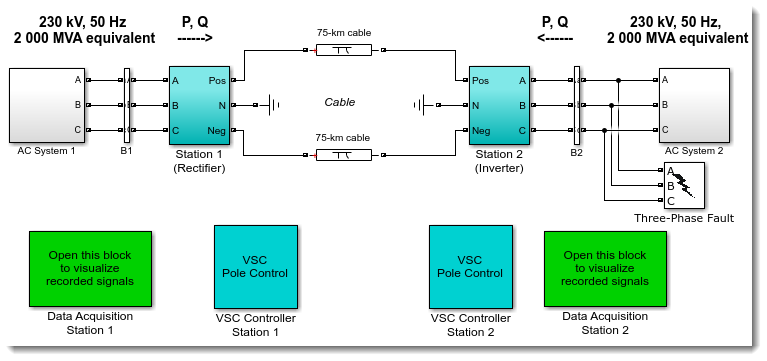
Let's start with reviewing the overall system we are dealing with:

SchedulerOverview

In this system, the following happens:

  • The engine crankshaft is equipped with a toothed wheel. In this case, the teeth are equally spaced every 10 degrees, with one missing tooth.
  • When the crankshaft rotates, the teeth pass in front of a sensor that triggers an interrupt, executing code on the ECU.
  • The code computes the position and speed of the engine and determines when the next cylinder should fire.
  • The code sets a hardware timer that will fire the appropriate spark plug at the appropriate time.

The goal of this project is to design an algorithm to be executed by the Embedded Control Unit (ECU) Operating System (OS) scheduler. This algorithm computes the position and speed of the engine and determines when the next cylinder should fire. Once this is determined, the algorithm calls a timer service provided by the ECU OS that will take care of making the ignition happen at the right time.

Following the Model-Based Design philosophy, we (of course!) want to simulate the entire system to help to design and validate the control algorithm that will be deployed on the ECU.

Important Model Architecture Decision: Importing Code versus Exporting Code

Before describing the controller and its implementation, I want to cover an important design choice I made for this example.

On this blog, in most of my posts involving code generation, the end of the story is: Click the Build button to generate code, and the final executable is automatically compiled and executed on the target. This is how Simulink Real-Time and our support packages for targets like Raspberry Pi or iPhone/iPad work. In those cases, if the final application requires legacy C/C++ code to be included the code is imported in Simulink, typically using a TLC wrapper. See my blogs about a Tweeting Raspberry Pi or Custom driver for LEGO MINDSTORM for examples.

This is one way of doing things... we call it the Import Workflow.

Now, it is time to go read the documentation page Choose an External Code Integration Workflow to learn about the other way of doing things... the Export Workflow.

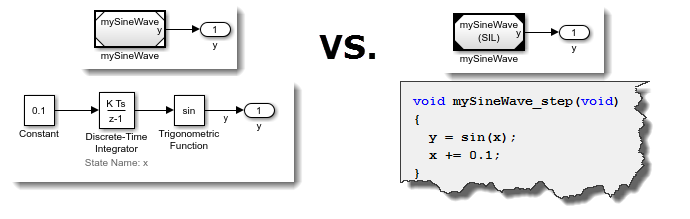
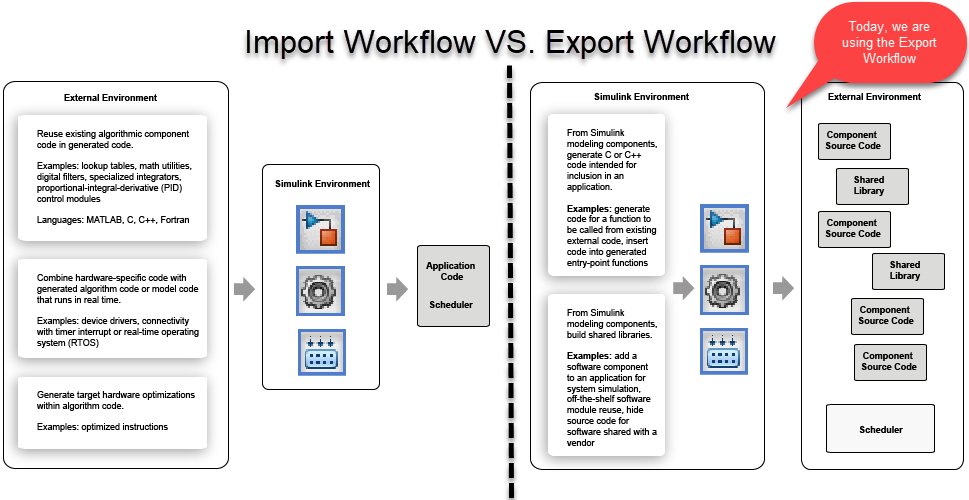
Here is a schematic comparing those two workflows side by side:

Import Vs Export

Why did I choose the Export Workflow for this project?

The use case addressed by the Export Workflow is where you have an existing large C/C++ software project composed of hand-written and legacy components. In such case, if you want to develop a new component in Simulink, you can export the generated code and include it in the existing software project.

That way, the code exported by Simulink can both be called by the legacy code, and call legacy code. In the next sections, we will see:

  • How the final application deployed on the embedded controller looks
  • How the simulation of the entire system looks
  • How to emulate a legacy scheduler executing code exported from Simulink
  • How to setup part of a model to generate code compatible with the Export Workflow
  • How to emulate services provided by the ECU being utilized by the code exported from Simulink

The Final Application Deployed on the Embedded Controller

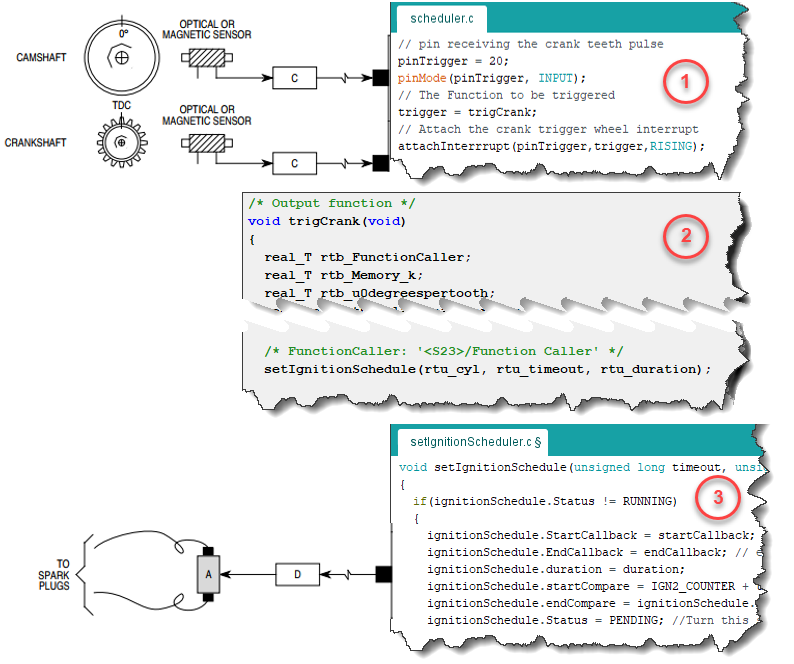
Here is a picture describing how the final deployed application looks. Note that, to make the difference between handwritten legacy code and Simulink-generated code more obvious, I took the screenshots of the legacy code using a different editor, the Arduino IDE.

Controller overview

In this picture, we have:

  1. The ECU scheduler registers the code exported from Simulink (trigCrank) to be executed based on the motion of the mechanical shaft.
  2. The code exported from Simulink (trigCrank) determines when the next spark ignition should happen.
  3. The code exported from Simulink calls a service provided by the ECU OS (setIgnitionSchedule) that will use a hardware timer to produce the spark ignition at the right time.

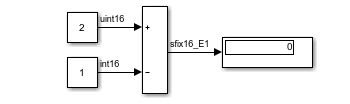
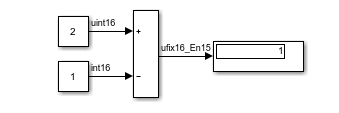
Simulating the Entire System

Here is a screenshot of the top level of the model simulating the entire system. I used the same numbering as in the above image to showcase which subsystem is equivalent to which part of the deployed application. This means that the Stateflow chart marked with a "1" and the Subsystem marked with a "3" are emulating legacy functionality provided by the ECU.
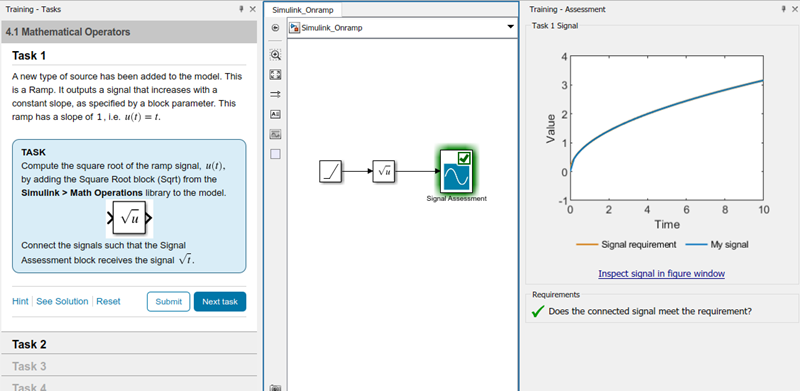
Controller Simulation overview

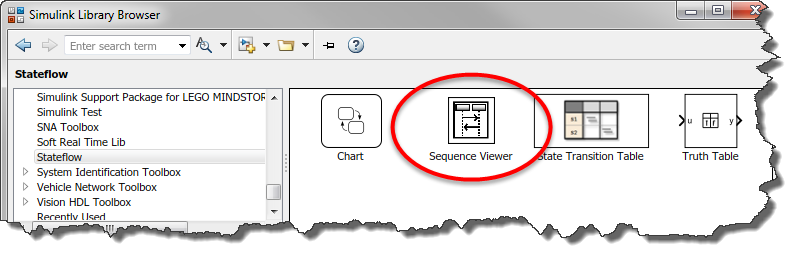
Emulating a Legacy Scheduler using Stateflow

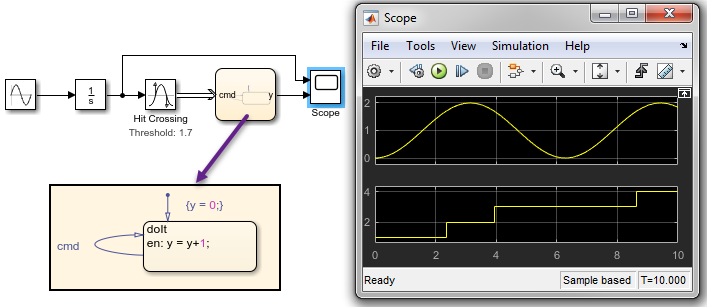
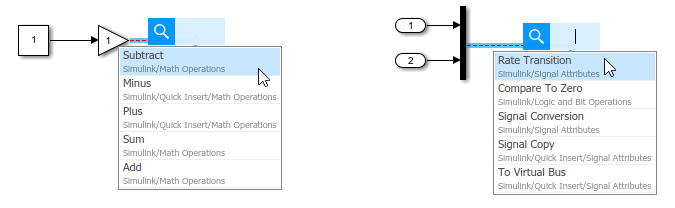
In the deployed application, the OS scheduler calls functions. In Simulink, this means that we need to generate Function-call signals. For periodic events, it is simple: we can use the Function-Call Generator block.

To generate function-call signals when the crank-angle passes specific angles, I used a block from the example model sfcndemo_angle_events.slx, which is part of the S-Function Examples. I simply had to connect it to the crankshaft and camshaft and specify the teeth pattern in the block dialog.

Async S-Function.

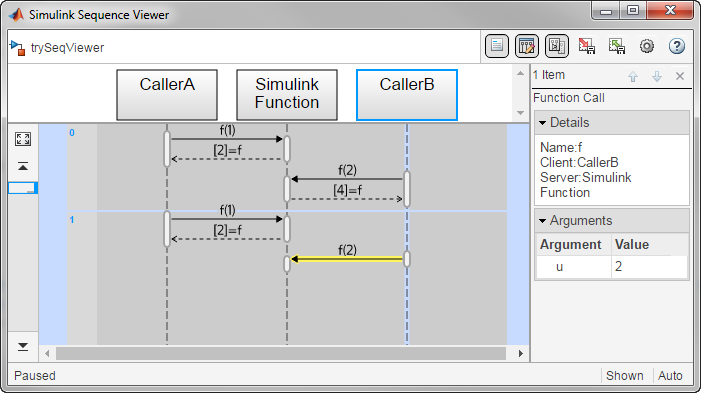
Using zero-crossing detection, this block will accurately generate function-call events every time a tooth is hit. I can then combine those events with a periodic function-call generated using a Function-Call Generator block to trigger the scheduling chart:

Stateflow scheduler

The Stateflow chart then outputs function-call signals that will execute the control algorithm for which we want to export code.

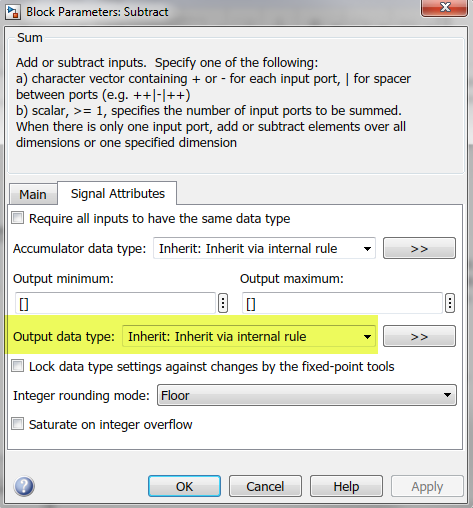
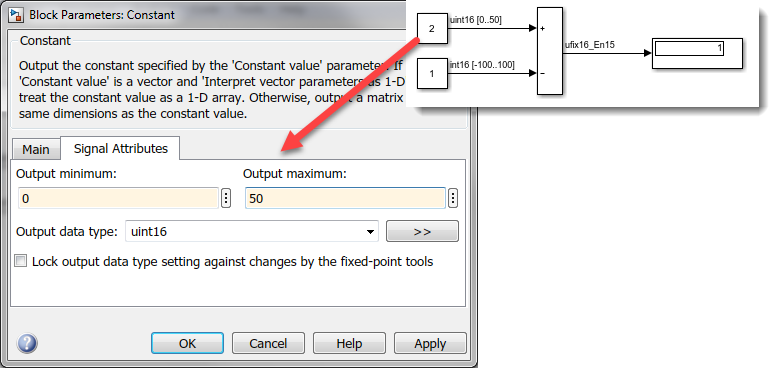
Setting Up Part of a Model to Generate Code Compatible with the Export Workflow

Now it's time to talk about that control algorithm for which we want to export the generated code!

To be compatible with the Export Workflow, we placed the algorithm inside a separate model and referenced it in our system simulation using a model block.

To make it an Export-Function Model, the control algorithm must be placed inside Function-Call Subsystems which are triggered by Root-Level Inport blocks marked to output Function-Call signals.

When generating code for this model, in contrast to "normal" models, no step function will be generated. Instead, one function per root-level function-call Inport will be generated.

Export Function Model and code

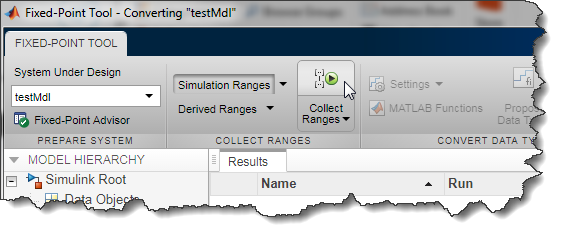
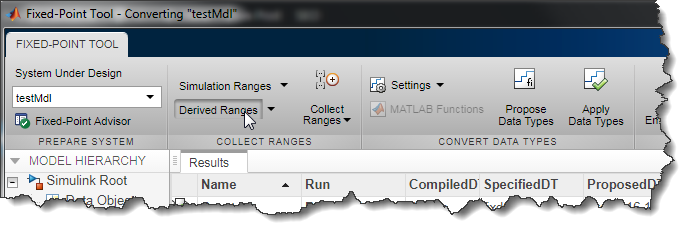
Emulating Services Provided by the ECU

Last piece of the puzzle... the control algorithm needs to utilize functionalities provided by the ECU. In other words, it needs to call external functions - and we want to simulate those.

For that, in the export function model, I used a Function Caller block to be executed when it is time to schedule when the next cylinder needs to fire.

This Function Caller block will behave differently in the generated code and in simulation:

  • The code generated for Function Caller blocks will call and link against functions available on the ECU.
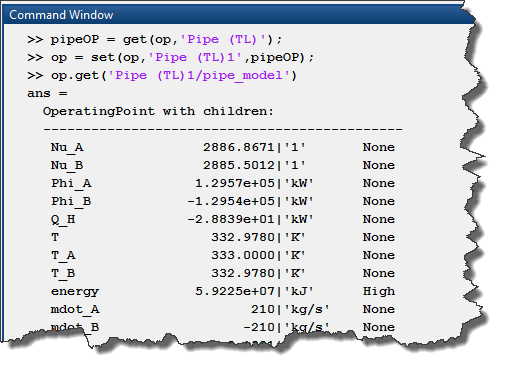
  • When referenced in our system simulation model, the Function Caller block will call a Simulink Function located in the top simulation model.

    Function caller

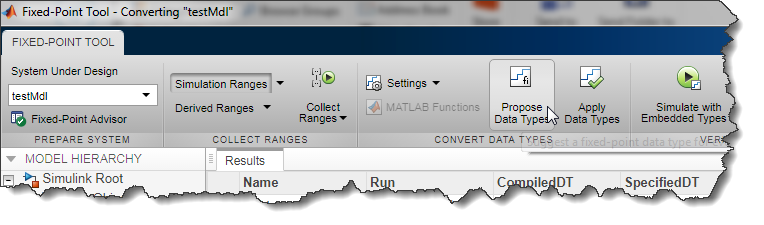
    For this specific application, the OS service that needs to be emulated is a hardware timer that will fire the spark plug after a desired amount of time. For that, I decided to use SimEvents.

    The Simulink Function generates a SimEvents message, or entity. This entity passes through two Entity Server blocks. The first one serves it until it's time to charge the spark plug. The second serves it until it is time to discharge the spark plug. Every time the entity exits one of the two servers, they call the Simulink Function trigCyl that generates the ignition signals sent to the engine.

    SimEvents

    And the loop is now closed!

    Simulation Results

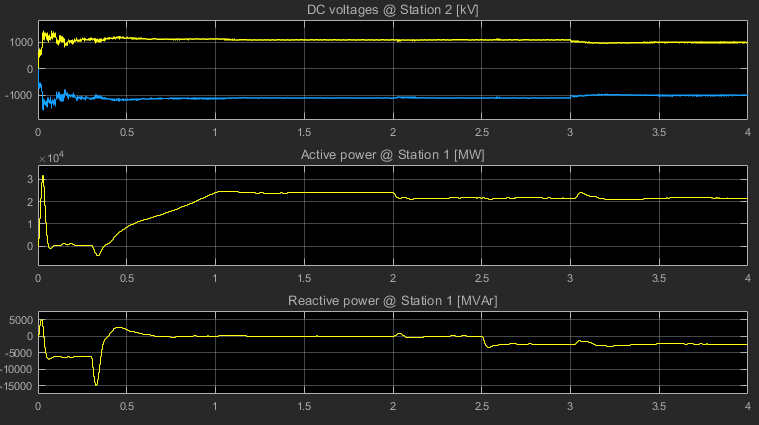
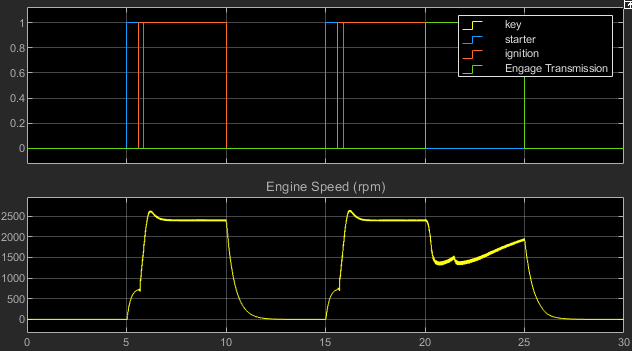
    When you simulate the model, you will see how the engine RPM evolves as we start and shut down the engine, and when we engage the transmission.

    Results 1

    If you zoom on the ignition command, you will see when each cylinder is fired as the crankshaft rotates.

    Results 2

    Now it's your turn

    Let us know in the comments what you think of this model architecture and if there are other features for which you would like to see this kind of example.

Viewing all 159 articles
Browse latest View live